
Back to Courses


Data Science Courses - Page 105
Showing results 1041-1050 of 1407
Math behind Moneyball
Learn how probability, math, and statistics can be used to help baseball, football and basketball teams improve, player and lineup selection as well as in game strategy.
Case studies in business analytics with ACCENTURE
Who is this course for ?
This course is RESTRICTED TO LEARNERS ENROLLED IN Strategic Business Analytics SPECIALIZATION as a preparation to the capstone project. During the first two MOOCs, we focused on specific techniques for specific applications. Instead, with this third MOOC, we provide you with different examples to open your mind to different applications from different industries and sectors.
The objective is to give you an helicopter overview on what's happening in this field. You will see how the tools presented in the two previous courses of the Specialization are used in real life projects.
We want to ignite your reflection process. Hence, you will best make use of the Accenture cases by watching first the MOOC and then investigate by yourself on the different concepts, industries, or challenges that are introduced during the videos.
At the end of this course learners will be able to:
- identify the possible applications of business analytics,
- hence, reflect on the possible solutions and added-value applications that could be proposed for their capstone project.
The cases will be presented by senior practitioners from Accenture with different backgrounds in term of industry, function, and country. Special attention will be paid to the "value case" of the issue raised to prepare you for the capstone project of the specialization.
About Accenture
Accenture is a leading global professional services company, providing a broad range of services and solutions in strategy, consulting, digital, technology and operations. Combining unmatched experience and specialized skills across more than 40 industries and all business functions—underpinned by the world’s largest delivery network—Accenture works at the intersection of business and technology to help clients improve their performance and create sustainable value for their stakeholders. With more than 358,000 people serving clients in more than 120 countries, Accenture drives innovation to improve the way the world works and lives. Visit us at www.accenture.com.
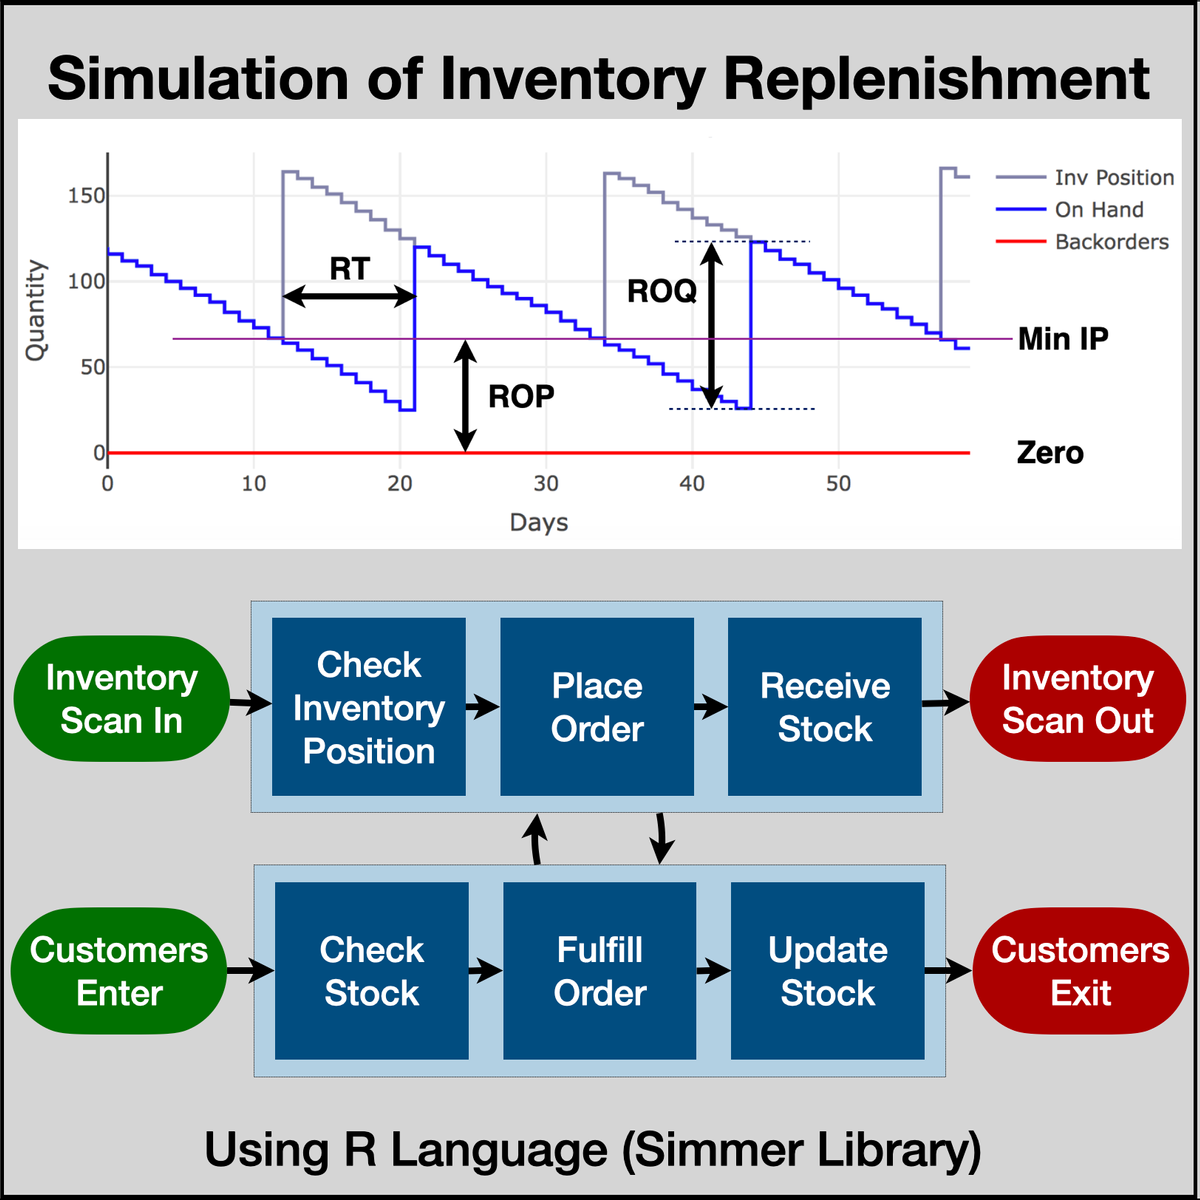
Simulation of Inventory Replenishment Using R Simmer
By the end of this project, you will gain introductiory knowledge of Discrete Event Simulation, Inventory Replenishment, be able to use R Studio and Simmer library, create statistical variables required for simulation, define process trajectory, define and assign resources, define arrivals (eg. incoming customers / work units), run simulation in R, store results in data frames, plot charts and interpret the results.
Excel Power Tools for Data Analysis
Welcome to Excel Power Tools for Data Analysis. In this four-week course, we introduce Power Query, Power Pivot and Power BI, three power tools for transforming, analysing and presenting data.
Excel's ease and flexibility have long made it a tool of choice for doing data analysis, but it does have some inherent limitations: for one, truly "big" data simply does not fit in a spreadsheet and for another, the process of importing and cleaning data can be a repetitive, time-consuming and error-prone. Over the last few years, Microsoft have worked on transforming the end-to-end experience for analysts, and Excel has undergone a major upgrade with the inclusion of Power Query and Power Pivot.
In this course, we will learn how to use Power Query to automate the process of importing and preparing data for analysis. We will see how Power Pivot revolutionises the actual analysis process by providing us with an analytical database inside the Excel workbook, capable of storing millions of rows, and a powerful modelling language called DAX which allows us to perform advanced analytics on our data. We will finish off by venturing out of Excel and introducing Power BI, which also uses the Power Query and Power BI architecture but allows us to create stunning interactive reports and dashboards.
This is the third course in our Specialization on Data Analytics and Visualization. The previous courses: Excel Fundamentals for Data Analysis and Data Visualization in Excel, cover data preparation, cleaning, visualisation, and creating dashboards. To get the most out of this course we would recommend you do the previous courses or have experience with these topics. In this course we focus on Excel Power Tools, join us for this exciting journey.
Please note that Power Query, Power Pivot and Power BI Desktop are only available on the Windows platform, so Mac users will require Bootcamp running Windows or a Virtual machine with a Window O/S. While Power Query is available as an add-in Excel 2010 and 2013, the tools have changed significantly, and this course has only been designed and tested for Excel 2016 and later. For an optimal experience, we recommend Office 365.
Simple Recurrent Neural Network with Keras
In this hands-on project, you will use Keras with TensorFlow as its backend to create a recurrent neural network model and train it to learn to perform addition of simple equations given in string format. You will learn to create synthetic data for this problem as well. By the end of this 2-hour long project, you will have created, trained, and evaluated a sequence to sequence RNN model in Keras. Computers are already pretty good at math, so this may seem like a trivial problem, but it’s not! We will give the model string data rather than numeric data to work with. This means that the model needs to infer the meaning of various characters from a sequence of text input and then learn addition from the given data.
This course runs on Coursera's hands-on project platform called Rhyme. On Rhyme, you do projects in a hands-on manner in your browser. You will get instant access to pre-configured cloud desktops containing all of the software and data you need for the project. Everything is already set up directly in your internet browser so you can just focus on learning. For this project, you’ll get instant access to a cloud desktop with Python, Jupyter, and Tensorflow pre-installed.
Please note that you will need some experience in Python programming, and a theoretical understanding of Neural Networks to be able to finish this project successfully.
Notes:
- You will be able to access the cloud desktop 5 times. However, you will be able to access instructions videos as many times as you want.
- This course works best for learners who are based in the North America region. We’re currently working on providing the same experience in other regions.
Applying Data Analytics in Accounting
This course explores business analytic applications in accounting. First, it presents a survey of technology topics in accounting, including process mining, blockchain and applications in audit, tax, and assurance. Next, the course explores visualization and basic analytics in audit and control testing using R and Alteryx. Next, the course examines the uses of text analysis in accounting and conducts text analysis using R and RStudio. Finally, the course examines robot process automation in general using UiPath and its applications in accounting.
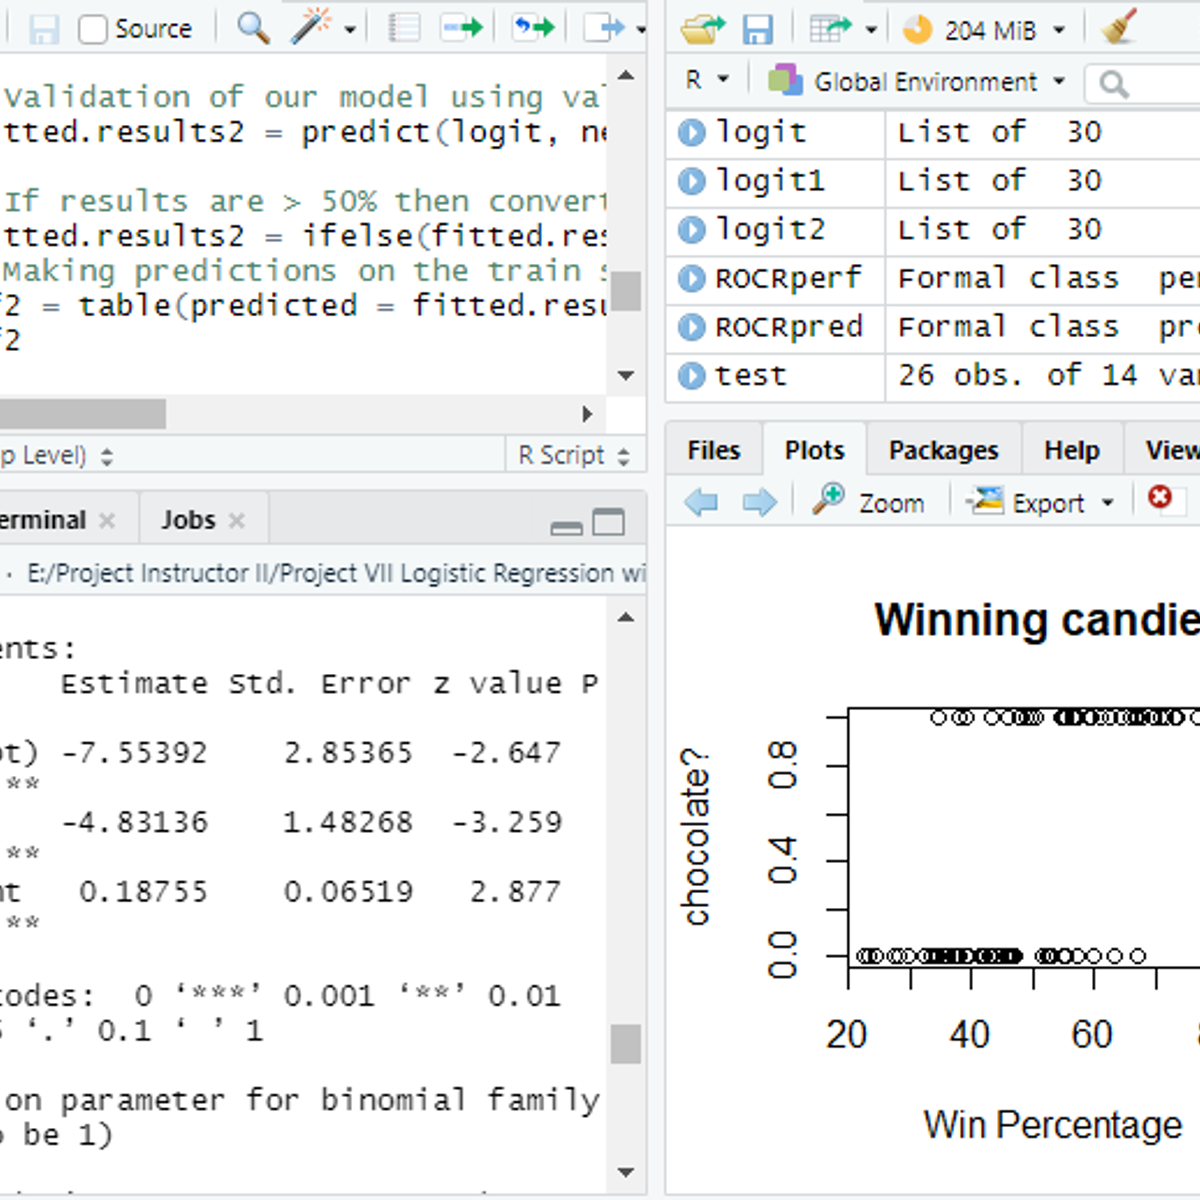
Logistic Regression&application as Classification Algorithm
In this project, you will learn about Logistic Regression and its application as Classification Algorithm. The project demonstrates the theoretical background of Logistic Regression using the Sigmoidal function. It also explains the suitability of linear vs logistic regression to answer the specific types of research questions. Finally, it covers an implementation of classification algorithm using logit model. The project utilizes the 'Candy' dataset for illustrative purpose.
Experimental Design Basics
This is a basic course in designing experiments and analyzing the resulting data. The course objective is to learn how to plan, design and conduct experiments efficiently and effectively, and analyze the resulting data to obtain objective conclusions. Both design and statistical analysis issues are discussed. Opportunities to use the principles taught in the course arise in all aspects of today’s industrial and business environment. Applications from various fields will be illustrated throughout the course. Computer software packages (JMP, Design-Expert, Minitab) will be used to implement the methods presented and will be illustrated extensively.
All experiments are designed experiments; some of them are poorly designed, and others are well-designed. Well-designed experiments allow you to obtain reliable, valid results faster, easier, and with fewer resources than with poorly-designed experiments. You will learn how to plan, conduct and analyze experiments efficiently in this course.
High-dimensional Data visualization techniques using python
By the end of this project you will learn how to analyze high-dimensional data using different visualization techniques. We are going to learn how to implement Scatterplot Matrix and Parallel coordinate plots (PCP) in python. and We will learn how to use these two high-dimensional data visualization techniques to analyze our data by solving three tasks: Outlier Detection, Correlation Analysis and Cluster analysis. we will also talk about Data reduction techniques. we will learn how to sample our data to reduce the number of the data points for a better visualization. We will also learn about the Dimensionality reduction technique to reduce the number of dimensions in our dataset and how it can help us for a better analysis.
Operational Analytics with Microsoft Azure Synapse Analytics
In this course, you will learn how to perform operational analytics against Azure Cosmos DB using the Azure Synapse Link feature within Azure Synapse Analytics.
You will learn how hybrid transactional and analytical processing can help you perform operational analytics with Azure Synapse Analytics. You will also learn how to configure and enable Azure Synapse Link to interact with Azure Cosmos DB and how you can perform analytics against Azure Cosmos DB using Azure Synapse Link.
This course is part of a Specialization intended for Data engineers and developers who want to demonstrate their expertise in designing and implementing data solutions that use Microsoft Azure data services for anyone interested in preparing for the Exam DP-203: Data Engineering on Microsoft Azure (beta). You will take a practice exam that covers key skills measured by the certification exam.
This is the seventh course in a program of 10 courses to help prepare you to take the exam so that you can have expertise in designing and implementing data solutions that use Microsoft Azure data services. The Data Engineering on Microsoft Azure exam is an opportunity to prove knowledge expertise in integrating, transforming, and consolidating data from various structured and unstructured data systems into structures that are suitable for building analytics solutions that use Microsoft Azure data services. Each course teaches you the concepts and skills that are measured by the exam.
By the end of this Specialization, you will be ready to take and sign-up for the Exam DP-203: Data Engineering on Microsoft Azure (beta).
Popular Internships and Jobs by Categories
Browse
© 2024 BoostGrad | All rights reserved