
Back to Courses


Data Science Courses - Page 104
Showing results 1031-1040 of 1407
Inventory Management
Inventory is a strategic asset for organizations. The effective management of inventory can minimize a company’s spending while dramatically increasing its profit. In this course, we will explore how to use data science to manage inventory in uncertain environments, how to set inventory levels based on customer service requirements, and how to calculate inventory for products that have short sales cycles.
Translate Text with the Cloud Translation API
This is a self-paced lab that takes place in the Google Cloud console.
The Cloud Translation allows you to translate an arbitrary string into any supported language. In this hands-on lab you’ll learn how to use the Cloud Translation API to translate text and detect the language of text if the language is unknown.
Exploring Dataset Metadata Between Projects with Data Catalog
This is a self-paced lab that takes place in the Google Cloud console. In this lab, you will explore existing datasets with Data Catalog and mine the table and column metadata for insights.
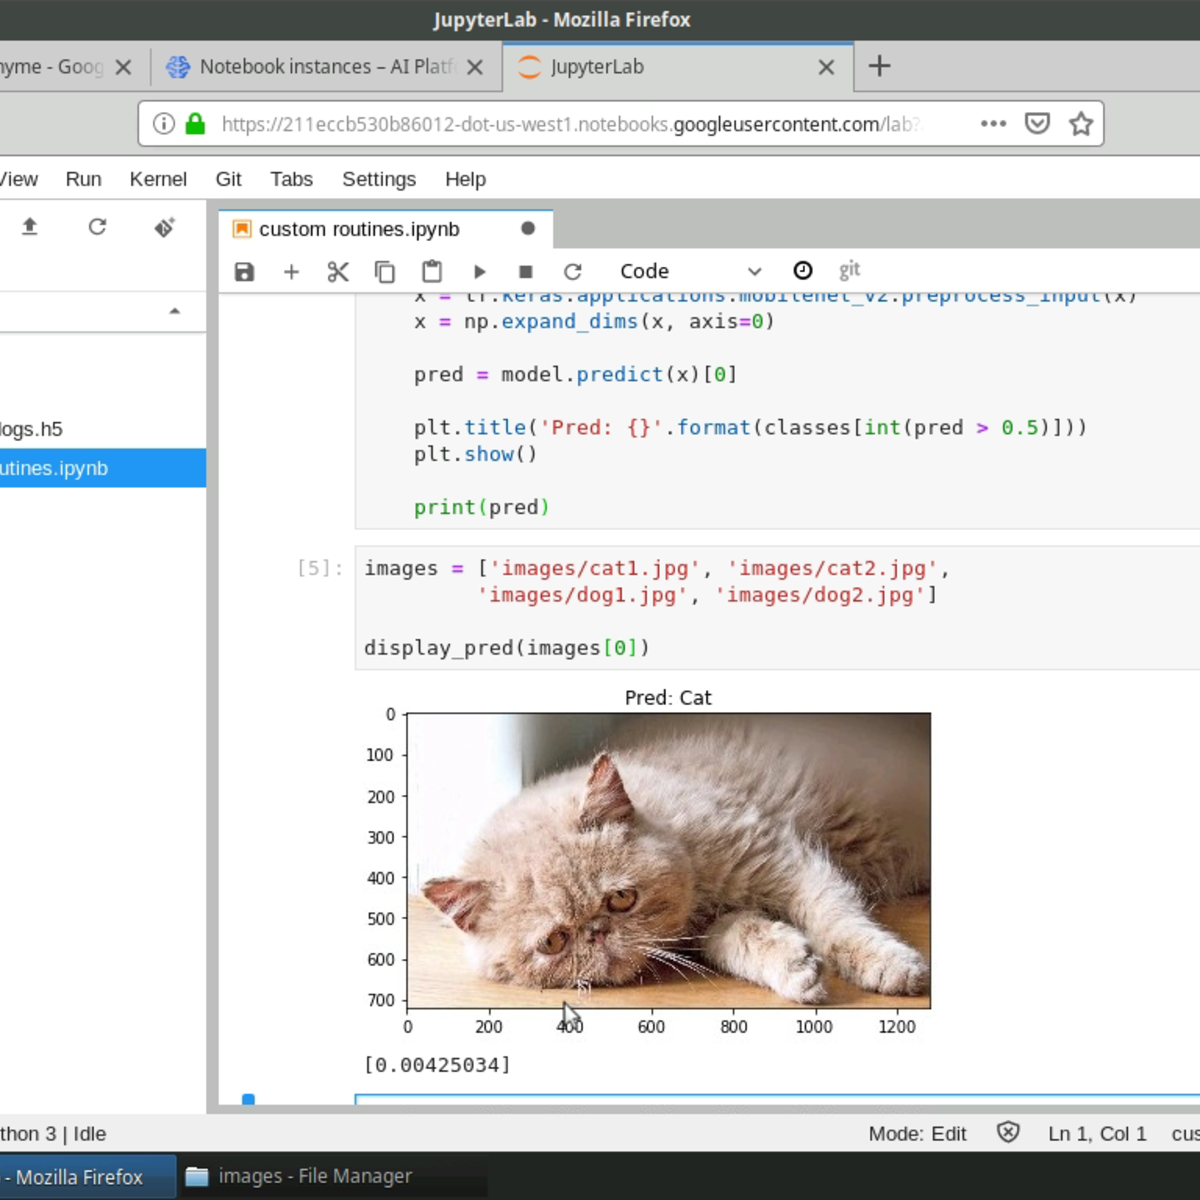
Custom Prediction Routine on Google AI Platform
Please note: You will need a Google Cloud Platform account to complete this course. Your GCP account will be charged as per your usage. Please make sure that you are able to access Google AI Platform within your GCP account. You should be familiar with python programming, and Google Cloud Platform before starting this hands on project. Please also ensure that you have access to the custom prediction routine feature in Google AI Platform.
In this 2-hour long project-based course, you will learn how to deploy, and use a model on Google’s AI Platform. Normally, any model trained with the TensorFlow framework is quite easy to deploy, and you can simply upload a Saved Model on Google Storage, and create an AI Platform model with it. But, in practice, we may not always use TensorFlow. Fortunately, the AI Platform allows for custom prediction routines as well and that’s what we are going to focus on. Instead of converting a Keras model to a TensorFlow Saved Model, we will use the h5 file as is. Additionally, since we will be working with image data, we will use this opportunity to look at encoding and decoding of byte data into string for data transmission and then encoding of the received data in our custom prediction routine on the AI Platform before using it with our model.
This course runs on Coursera's hands-on project platform called Rhyme. On Rhyme, you do projects in a hands-on manner in your browser. You will get instant access to pre-configured cloud desktops containing all of the software and data you need for the project. Everything is already set up directly in your Internet browser so you can just focus on learning. For this project, you’ll get instant access to a cloud desktop with (e.g. Python, Jupyter, and Tensorflow) pre-installed.
Note: This course works best for learners who are based in the North America region. We’re currently working on providing the same experience in other regions.
Using Advanced Formulas and Functions in Excel
In this project, you will learn the advanced formulas and functions in Excel to perform analysis on several different topics. First, we will review basic formulas and functions and take a tour through the many choices in the Excel Formulas tab. Then we will explore the advanced financial formulas and functions followed by logic and text. Last, we will learn many ways to perform lookup and reference type queries. Throughout the project, you will work through some examples that will show you how to apply the formulas and functions you have learned.
Naive Bayes 101: Resume Selection with Machine Learning
In this project, we will build a Naïve Bayes Classifier to predict whether a given resume text is flagged or not. Our training data consist of 125 resumes with 33 flagged resumes and 92 non flagged resumes. This project could be practically used to screen resumes in companies.
Fundamentals of Machine Learning for Healthcare
Machine learning and artificial intelligence hold the potential to transform healthcare and open up a world of incredible promise. But we will never realize the potential of these technologies unless all stakeholders have basic competencies in both healthcare and machine learning concepts and principles.
This course will introduce the fundamental concepts and principles of machine learning as it applies to medicine and healthcare. We will explore machine learning approaches, medical use cases, metrics unique to healthcare, as well as best practices for designing, building, and evaluating machine learning applications in healthcare.
The course will empower those with non-engineering backgrounds in healthcare, health policy, pharmaceutical development, as well as data science with the knowledge to critically evaluate and use these technologies.
Co-author: Geoffrey Angus
Contributing Editors:
Mars Huang
Jin Long
Shannon Crawford
Oge Marques
The Stanford University School of Medicine is accredited by the Accreditation Council for Continuing Medical Education (ACCME) to provide continuing medical education for physicians. Visit the FAQs below for important information regarding 1) Date of original release and Termination or expiration date; 2) Accreditation and Credit Designation statements; 3) Disclosure of financial relationships for every person in control of activity content.
Reinforcement Learning in Finance
This course aims at introducing the fundamental concepts of Reinforcement Learning (RL), and develop use cases for applications of RL for option valuation, trading, and asset management.
By the end of this course, students will be able to
- Use reinforcement learning to solve classical problems of Finance such as portfolio optimization, optimal trading, and option pricing and risk management.
- Practice on valuable examples such as famous Q-learning using financial problems.
- Apply their knowledge acquired in the course to a simple model for market dynamics that is obtained using reinforcement learning as the course project.
Prerequisites are the courses "Guided Tour of Machine Learning in Finance" and "Fundamentals of Machine Learning in Finance". Students are expected to know the lognormal process and how it can be simulated. Knowledge of option pricing is not assumed but desirable.
Data Visualization using dplyr and ggplot2 in R
Welcome to this project-based course Data Visualization using ggplot2 and dplyr in R. In this project, you will learn how to manipulate data with the dplyr package and create beautiful plots using the ggplot2 package in R.
By the end of this 2-hour long project, you will understand how to use different dplyr verbs such as the select verb, filter verb, arrange verb, mutate verb, summarize verb, and the group_by verb to manipulate the gapminder dataset. You will also learn how to use the ggplot2 package to render beautiful plots from the data returned from using the dplyr verbs.
Note that this is a follow-up to the project on Data Manipulation with dplyr in R. I recommend that you take the Data Manipulation with dplyr in R project before taking this project. This will give you better experience working on this project.
Overview of Data Visualization
In this project, you will develop an understanding and appreciation for data visualization. You will review the benefits of data visualization as you examine existing examples of data that is displayed in a variety of visual formats. In addition, you will gain some hands-on experience in building your own data visualization examples by aggregating data and generating simple charts in Google Sheets.
Note: This course works best for learners who are based in the North America region. We’re currently working on providing the same experience in other regions.
Popular Internships and Jobs by Categories
Browse
© 2024 BoostGrad | All rights reserved