Back to Courses


Data Analysis Courses
Showing results 1-10 of 998
Dealing With Missing Data
This course will cover the steps used in weighting sample surveys, including methods for adjusting for nonresponse and using data external to the survey for calibration. Among the techniques discussed are adjustments using estimated response propensities, poststratification, raking, and general regression estimation. Alternative techniques for imputing values for missing items will be discussed. For both weighting and imputation, the capabilities of different statistical software packages will be covered, including R®, Stata®, and SAS®.
Cluster Analysis using RCmdr
In this 1-hour long project-based course, we will show you how to do cluster analysis using RCmdr using the k means method and Hierarchical method. This project uses data about 29 cars and has 22 dimensions such as price , acceleration and we will use these methods to cluster groups .
Note: This course works best for learners who are based in the North America region. We’re currently working on providing the same experience in other regions.
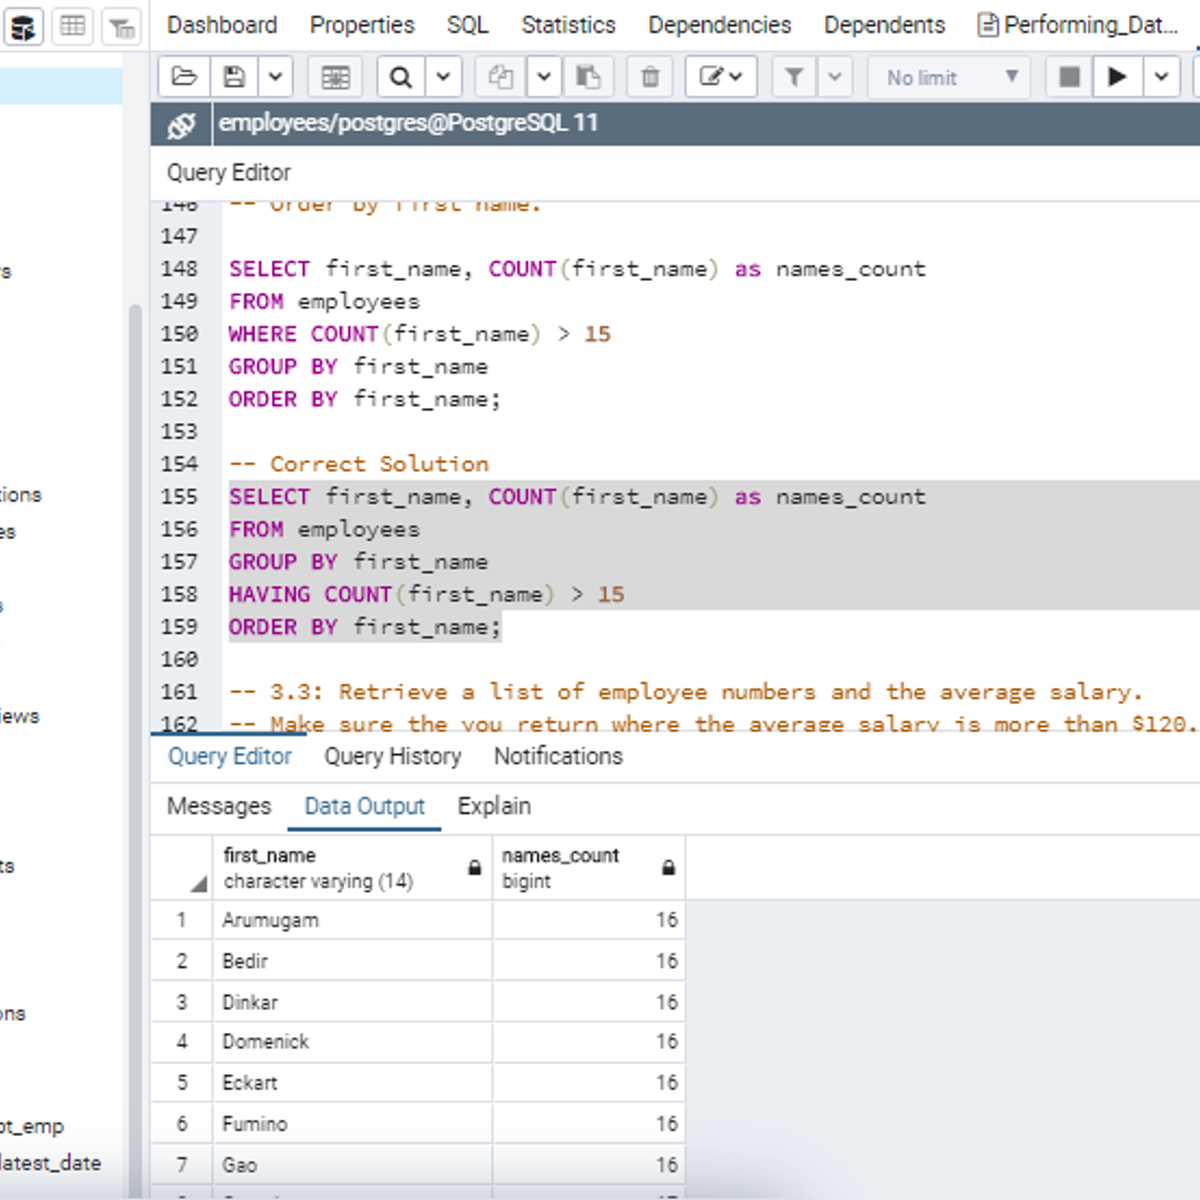
Performing Data Aggregation using SQL Aggregate Functions
In this 2-hour long project-based course, you will learn how to retrieve data from tables in a database using SQL SELECT statement with SQL Aggregate functions. The aggregate functions we will consider in this project are COUNT, SUM, MIN, MAX and AVG. Aggregate functions are used to summarize data from rows of a table into a single value. In addition, you will learn how to set conditions on the output of an aggregate function using the HAVING clause. Finally, you will learn how to tidy up the result set of aggregate functions using the ROUND function.
Note: You do not need to be a data administrator or data analyst to be successful in this guided project, just a familiarity with querying databases using SQL SELECT statement suffice for this project. If you are not familiar with SQL and want to learn the basics, start with my previous guided projects titled “Performing Data definition and Manipulation in SQL." and “Querying Databases using SQL SELECT statement”
Social Network Analysis
This course is designed to quite literally ‘make a science’ out of something at the heart of society: social networks. Humans are natural network scientists, as we compute new network configurations all the time, almost unaware, when thinking about friends and family (which are particular forms of social networks), about colleagues and organizational relations (other, overlapping network structures), and about how to navigate delicate or opportunistic network configurations to save guard or advance in our social standing (with society being one big social network itself). While such network structures always existed, computational social science has helped to reveal and to study them more systematically. In the first part of the course we focus on network structure. This looks as static snapshots of networks, which can be intricate and reveal important aspects of social systems. In our hands-on lab, you will also visualize and analyze a network with a software yourself, which will help to appreciate the complexity social networks can take on. During the second part of the course, we will look at how networks evolve in time. We ask how we can predict what kind of network will form and if and how we could influence network dynamics.
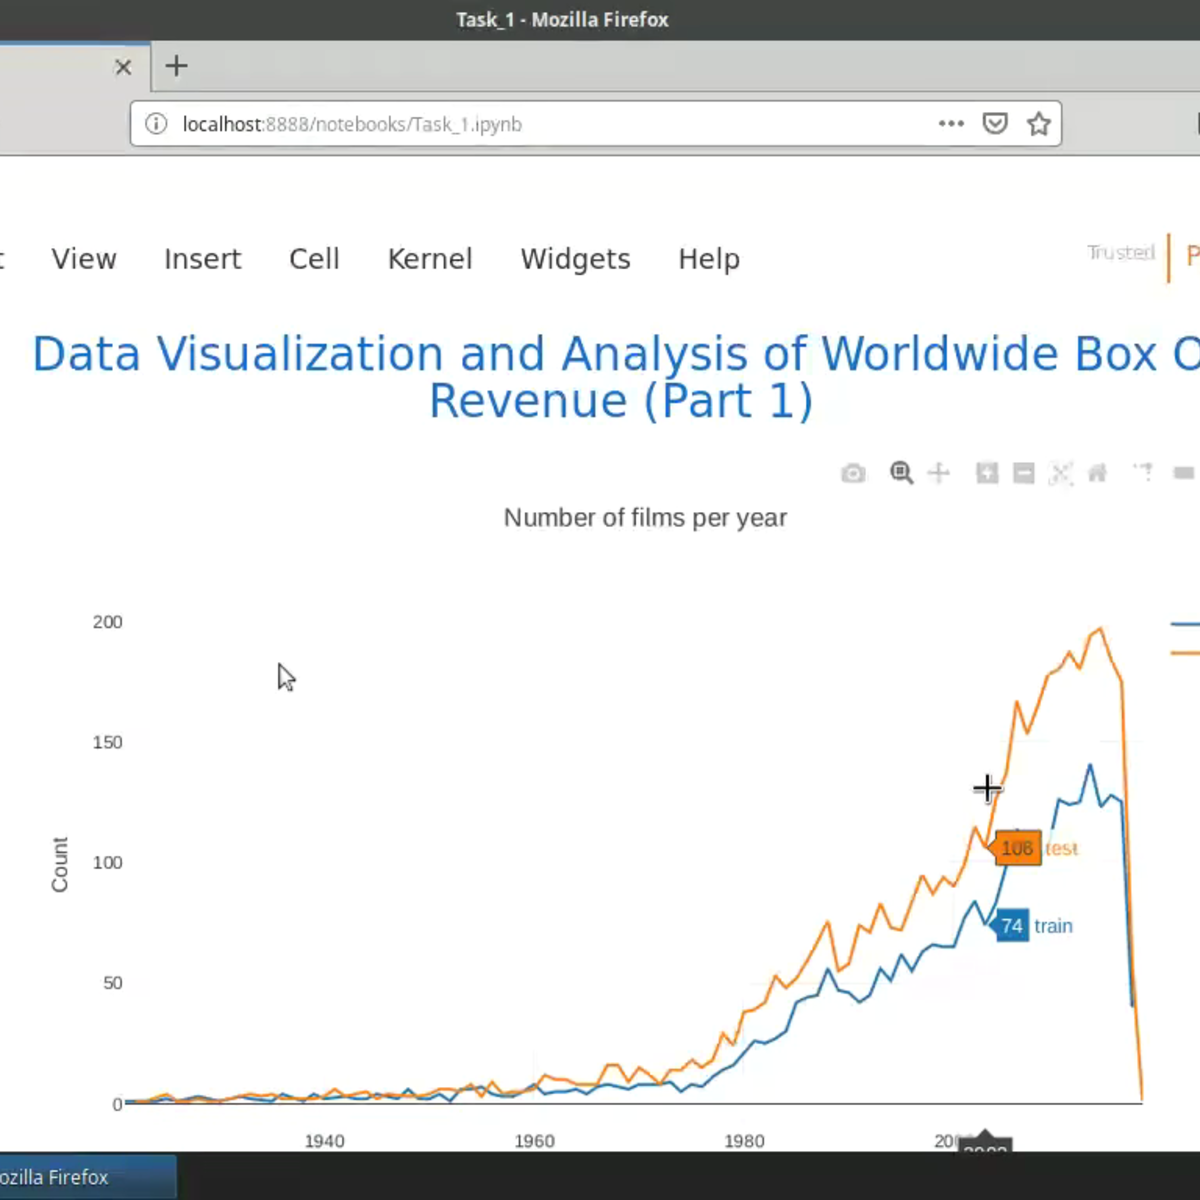
Analyze Box Office Data with Seaborn and Python
Welcome to this project-based course on Analyzing Box Office Data with Seaborn and Python. In this course, you will be working with the The Movie Database (TMDB) Box Office Prediction data set. The motion picture industry is raking in more revenue than ever with its expansive growth the world over. Can we build models to accurately predict movie revenue? Could the results from these models be used to further increase revenue? We try to answer these questions by way of exploratory data analysis (EDA) in this project and the next. The statistical data visualization libraries Seaborn and Plotly will be our workhorses to generate interactive, publication-quality graphs. By the end of this course, you will be able to produce data visualizations in Python with Seaborn, and apply graphical techniques used in exploratory data analysis (EDA).
This course runs on Coursera's hands-on project platform called Rhyme. On Rhyme, you do projects in a hands-on manner in your browser. You will get instant access to pre-configured cloud desktops containing all of the software and data you need for the project. Everything is already set up directly in your internet browser so you can just focus on learning. For this project, you’ll get instant access to a cloud desktop with Python, Jupyter, and scikit-learn pre-installed.
Notes:
- You will be able to access the cloud desktop 5 times. However, you will be able to access instructions videos as many times as you want.
- This course works best for learners who are based in the North America region. We’re currently working on providing the same experience in other regions.
Code Free Data Science
The Code Free Data Science class is designed for learners seeking to gain or expand their knowledge in the area of Data Science. Participants will receive the basic training in effective predictive analytic approaches accompanying the growing discipline of Data Science without any programming requirements. Machine Learning methods will be presented by utilizing the KNIME Analytics Platform to discover patterns and relationships in data. Predicting future trends and behaviors allows for proactive, data-driven decisions. During the class learners will acquire new skills to apply predictive algorithms to real data, evaluate, validate and interpret the results without any pre requisites for any kind of programming. Participants will gain the essential skills to design, build, verify and test predictive models.
You Will Learn
• How to design Data Science workflows without any programming involved
• Essential Data Science skills to design, build, test and evaluate predictive models
• Data Manipulation, preparation and Classification and clustering methods
• Ways to apply Data Science algorithms to real data and evaluate and interpret the results
Accounting Analytics
Accounting Analytics explores how financial statement data and non-financial metrics can be linked to financial performance. In this course, taught by Wharton’s acclaimed accounting professors, you’ll learn how data is used to assess what drives financial performance and to forecast future financial scenarios. While many accounting and financial organizations deliver data, accounting analytics deploys that data to deliver insight, and this course will explore the many areas in which accounting data provides insight into other business areas including consumer behavior predictions, corporate strategy, risk management, optimization, and more. By the end of this course, you’ll understand how financial data and non-financial data interact to forecast events, optimize operations, and determine strategy. This course has been designed to help you make better business decisions about the emerging roles of accounting analytics, so that you can apply what you’ve learned to make your own business decisions and create strategy using financial data.
Extract, Transform, and Load Data
This course is designed for business and data professional seeking to learn the first technical phase of the data science process known as Extract, Transform and Load or ETL.
Learners will be taught how to collect data from multiple sources so it is available to be transformed and cleaned and then will dive into collected data sets to prepare and clean data so that it can later be loaded into its ultimate destination. In the conclusion of the course learners will load data into its ultimate destination so that it can be analyzed and modeled.
The typical student in this course will have experience working with data and aptitude with computer programming.
Advanced AI Techniques for the Supply Chain
In this course, we’ll learn about more advanced machine learning methods that are used to tackle problems in the supply chain. We’ll start with an overview of the different ML paradigms (regression/classification) and where the latest models fit into these breakdowns. Then, we’ll dive deeper into some of the specific techniques and use cases such as using neural networks to predict product demand and random forests to classify products. An important part to using these models is understanding their assumptions and required preprocessing steps. We’ll end with a project incorporating advanced techniques with an image classification problem to find faulty products coming out of a machine.
Introduction to virtual networks in Microsoft Azure
This is an introductory project on creating Virtual Networks in the Azure Portal.
During each task, you'll be able to follow along and complete each step as I do, giving you a truly hands-on experience.
I will begin by showing you how to get started with Azure by creating an account and signing in.
From there we will get familiar with navigating the Azure Portal and begin the creation of our Azure virtual network. We will accomplish this by working our way through the various settings that will need to be configured for a successful configuration of our virtual network.
Once the virtual network is created and operational, we will then create and connect two cloud based virtual machines and test connectivity between them.
If you enjoy this project, we'd recommend exploring the Microsoft Azure Fundamentals AZ-900 Exam Prep Specialization: https://www.coursera.org/specializations/microsoft-azure-fundamentals-az-900
Popular Internships and Jobs by Categories
Find Jobs & Internships
Browse


© 2024 BoostGrad | All rights reserved