Back to Courses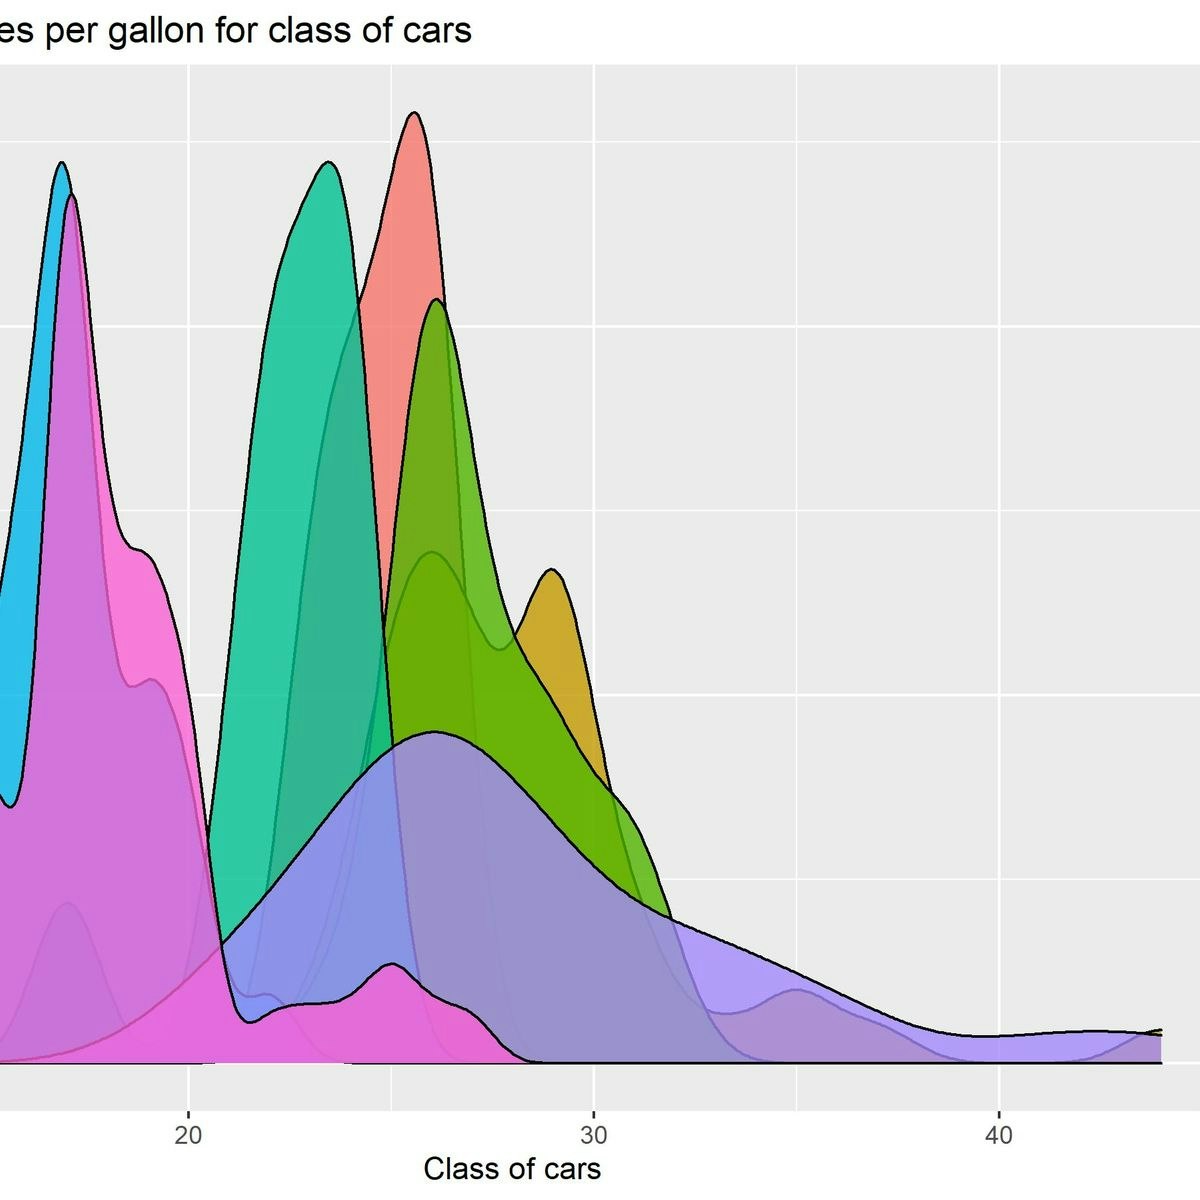


Data Analysis Courses - Page 2
Showing results 11-20 of 998
Introduction to EDA in R
Welcome to this project-based course Introduction to EDA in R. In this project, you will learn how to perform extensive exploratory data analysis on both quantitative and qualitative variables using basic R functions.
By the end of this 2-hour long project, you will understand how to create different basic plots in R. Also, you will learn how to create plots for categorical variables and numeric or quantitative variables. By extension, you will learn how to plot three variables and save your plot as an image in R.
Note, you do not need to be a data scientist to be successful in this guided project, just a familiarity with basic statistics and using R suffice for this project. If you are not familiar with R and want to learn the basics, start with my previous guided projects titled “Getting Started with R” and “Calculating Descriptive Statistics in R”
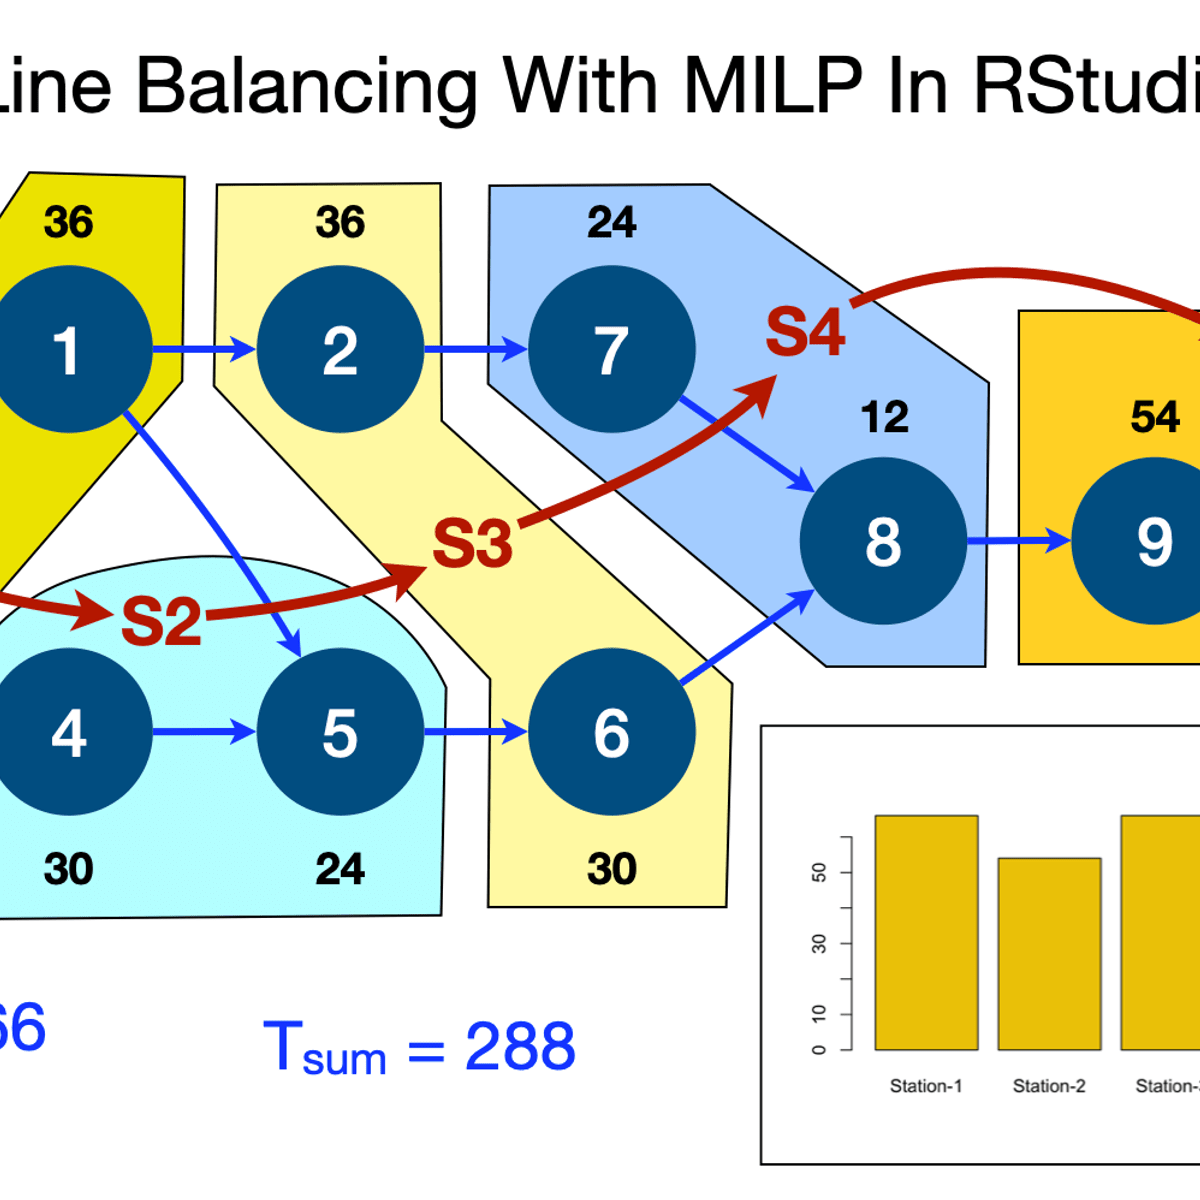
Line Balancing With MILP Optimization In RStudio
By the end of this project, you will learn to use R lpSolveAPI. You will learn to:
# Formulate Line Balancing Problem & Determine Objective Function
# Apply Constraints On Tasks Assignment To Stations
# Apply The Sum Of Durations Constraints On Tasks
# Apply Task Precedence Relationship Constraints
# Run Optimiser, Obtain & Analyse Solution
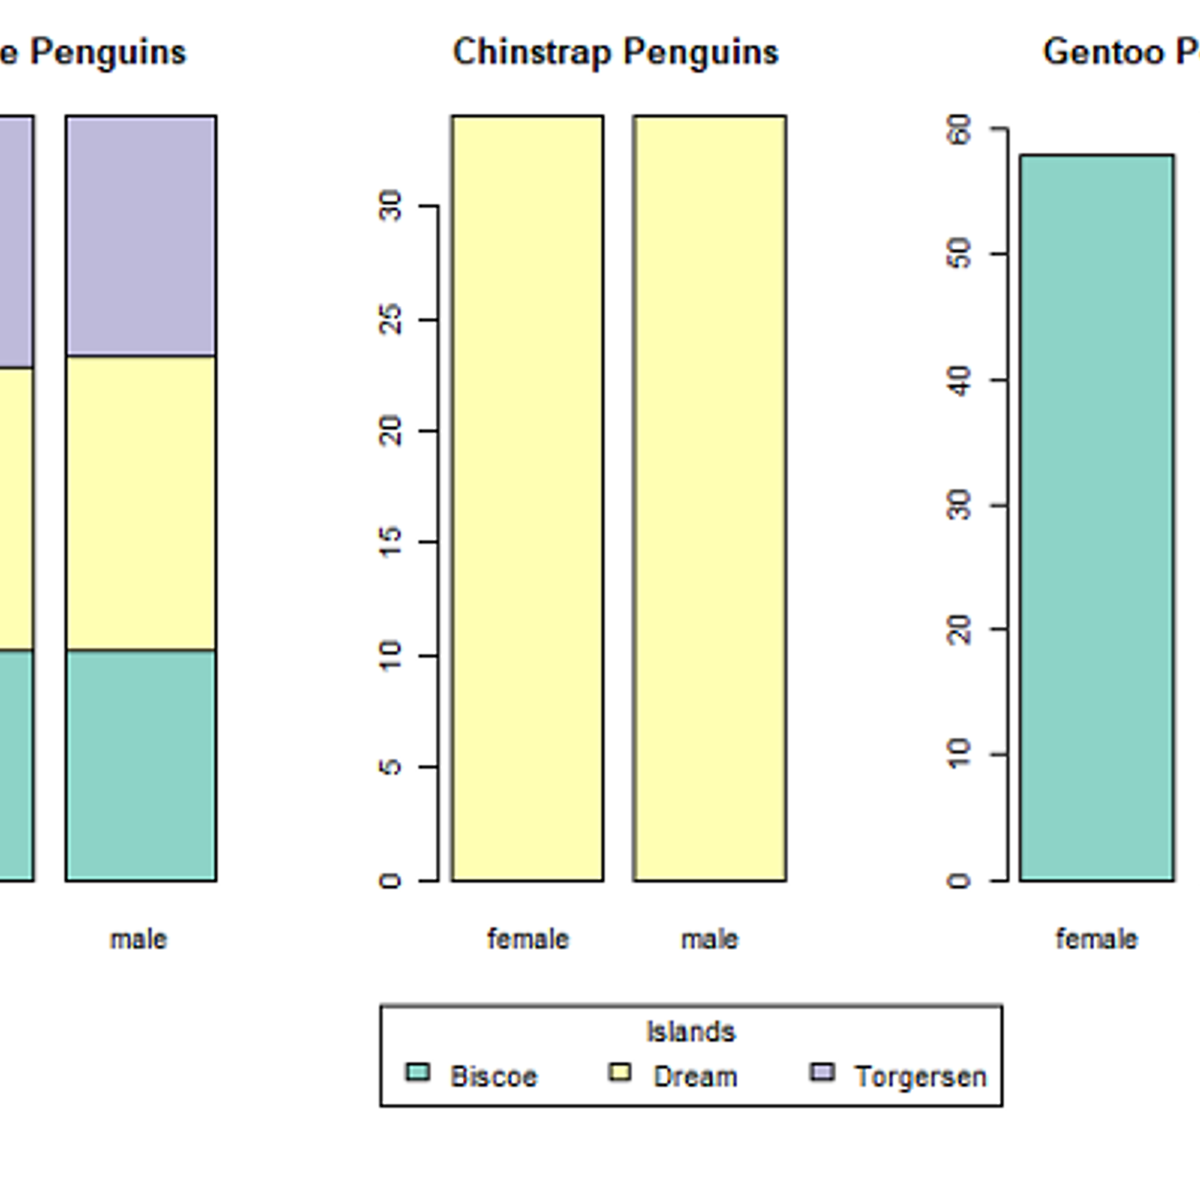
Visualization for Statistical Analysis
In this project you will learn about several visualization techniques and their importance for Statistical Analysis. The project demonstrates different plotting techniques, for example, histograms, scatter plots, box and whiskers plot, violin plot, bar plot, addition of regression line to scatter plot, and creating matrix of multiple plots. It also discusses the suitability of each plots according to the data type of the variables and illustrates multiple ways to achieve the desired plots efficiently. The project refers to 'Palmer Penguins' data set for the illustrative purpose.
Introduction to Microsoft Excel
By the end of this project, you will learn how to create an Excel Spreadsheet by using a free version of Microsoft Office Excel.
Excel is a spreadsheet that works like a database. It consists of individual cells that can be used to build functions, formulas, tables, and graphs that easily organize and analyze large amounts of information and data. Excel is organized into rows (represented by numbers) and columns (represented by letters) that contain your information. This format allows you to present large amounts of information and data in a concise and easy to follow format. Microsoft Excel is the most widely used software within the business community. Whether it is bankers or accountants or business analysts or marketing professionals or scientists or entrepreneurs, almost all professionals use Excel on a consistent basis.
You will learn what an Excel Spreadsheet is, why we use it and the most important keyboard shortcuts, functions, and basic formulas.
Introduction to Text Classification in R with quanteda
In this guided project you will learn how to import textual data stored in raw text files into R, turn these files into a corpus (a collection of textual documents), reshape them into paragraphs from documents and tokenize the text all using the R software package quanteda. You will then learn how to classify the texts using the Naive Bayes algorithm.
This guided project is for beginners interested in quantitative text analysis in R. It assumes no knowledge of textual analysis and focuses on exploring textual data (US Presidential Concession Speeches). Users should have a basic understanding of the statistical programming language R.
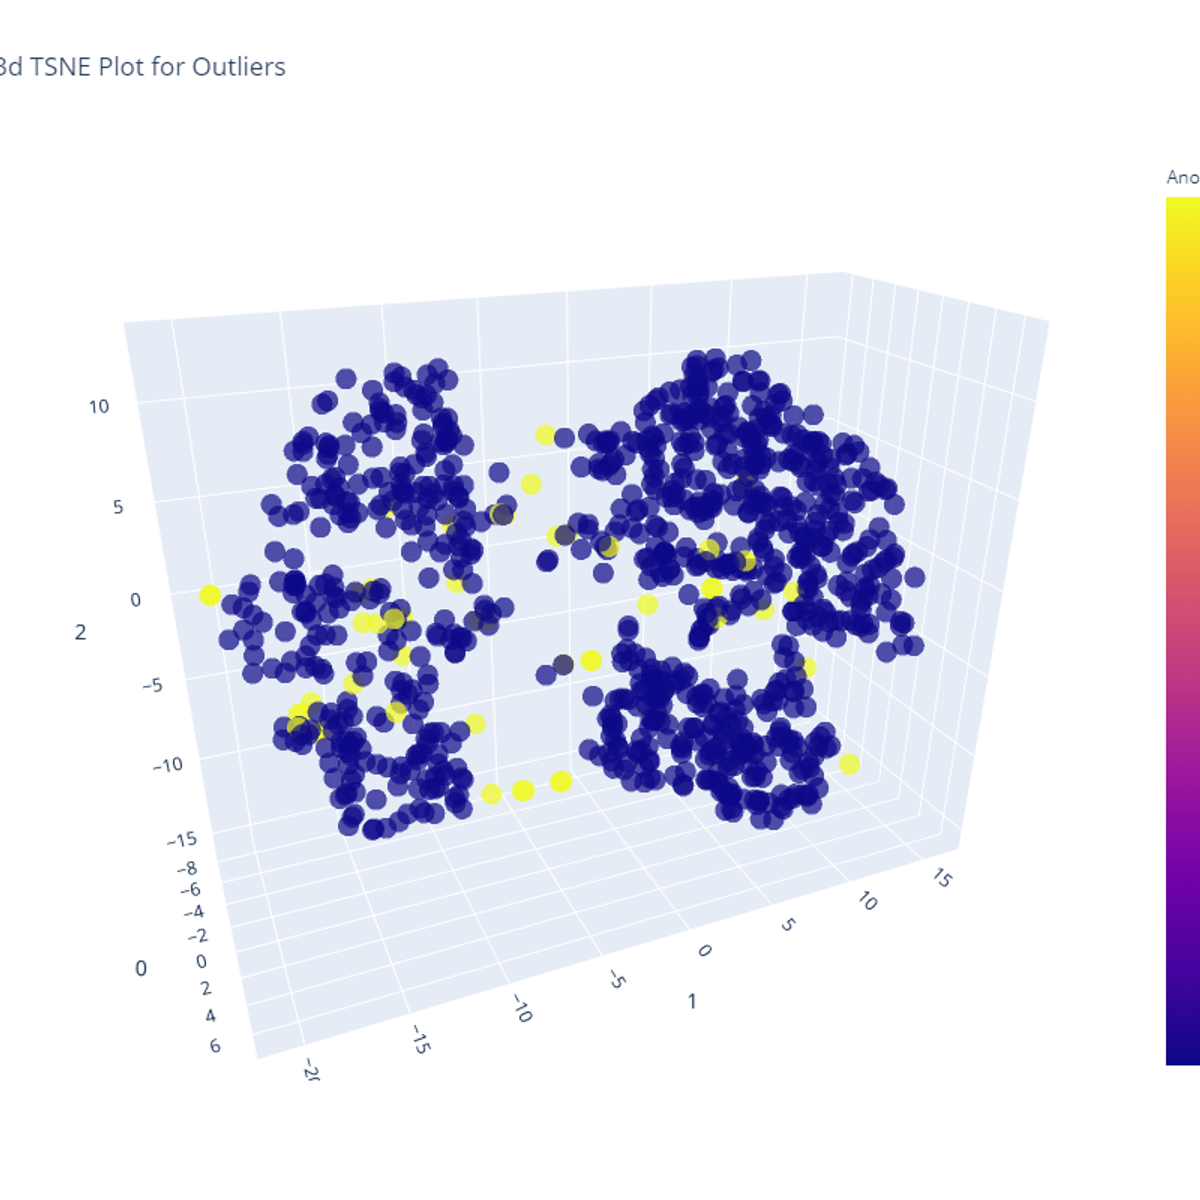
Build an Anomaly Detection Model using PyCaret
Build an Anomaly Detection Model using PyCaret
Fundamentals of Visualization with Tableau
In this first course of this specialization, you will discover what data visualization is, and how we can use it to better see and understand data. Using Tableau, we’ll examine the fundamental concepts of data visualization and explore the Tableau interface, identifying and applying the various tools Tableau has to offer. By the end of the course you will be able to prepare and import data into Tableau and explain the relationship between data analytics and data visualization. This course is designed for the learner who has never used Tableau before, or who may need a refresher or want to explore Tableau in more depth. No prior technical or analytical background is required. The course will guide you through the steps necessary to create your first visualization from the beginning based on data context, setting the stage for you to advance to the next course in the Specialization.
Data Analysis Tools
In this course, you will develop and test hypotheses about your data. You will learn a variety of statistical tests, as well as strategies to know how to apply the appropriate one to your specific data and question. Using your choice of two powerful statistical software packages (SAS or Python), you will explore ANOVA, Chi-Square, and Pearson correlation analysis. This course will guide you through basic statistical principles to give you the tools to answer questions you have developed. Throughout the course, you will share your progress with others to gain valuable feedback and provide insight to other learners about their work.
Diabetic Retinopathy Detection with Artificial Intelligence
In this project, we will train deep neural network model based on Convolutional Neural Networks (CNNs) and Residual Blocks to detect the type of Diabetic Retinopathy from images. Diabetic Retinopathy is the leading cause of blindness in the working-age population of the developed world and estimated to affect over 347 million people worldwide. Diabetic Retinopathy is disease that results from complication of type 1 & 2 diabetes and can develop if blood sugar levels are left uncontrolled for a prolonged period of time. With the power of Artificial Intelligence and Deep Learning, doctors will be able to detect blindness before it occurs.
Python Programming Essentials
This course will introduce you to the wonderful world of Python programming! We'll learn about the essential elements of programming and how to construct basic Python programs. We will cover expressions, variables, functions, logic, and conditionals, which are foundational concepts in computer programming. We will also teach you how to use Python modules, which enable you to benefit from the vast array of functionality that is already a part of the Python language. These concepts and skills will help you to begin to think like a computer programmer and to understand how to go about writing Python programs.
By the end of the course, you will be able to write short Python programs that are able to accomplish real, practical tasks. This course is the foundation for building expertise in Python programming. As the first course in a specialization, it provides the necessary building blocks for you to succeed at learning to write more complex Python programs.
This course uses Python 3. While many Python programs continue to use Python 2, Python 3 is the future of the Python programming language. This first course will use a Python 3 version of the CodeSkulptor development environment, which is specifically designed to help beginning programmers learn quickly. CodeSkulptor runs within any modern web browser and does not require you to install any software, allowing you to start writing and running small programs immediately. In the later courses in this specialization, we will help you to move to more sophisticated desktop development environments.
Popular Internships and Jobs by Categories
Find Jobs & Internships
Browse


© 2024 BoostGrad | All rights reserved