Back to Courses



Probability And Statistics Courses
Showing results 1-10 of 133

Bracketology with Google Machine Learning
This is a self-paced lab that takes place in the Google Cloud console. In this lab you use Machine Learning (ML) to analyze the public NCAA dataset and predict NCAA tournament brackets.

Introduction to EDA in R
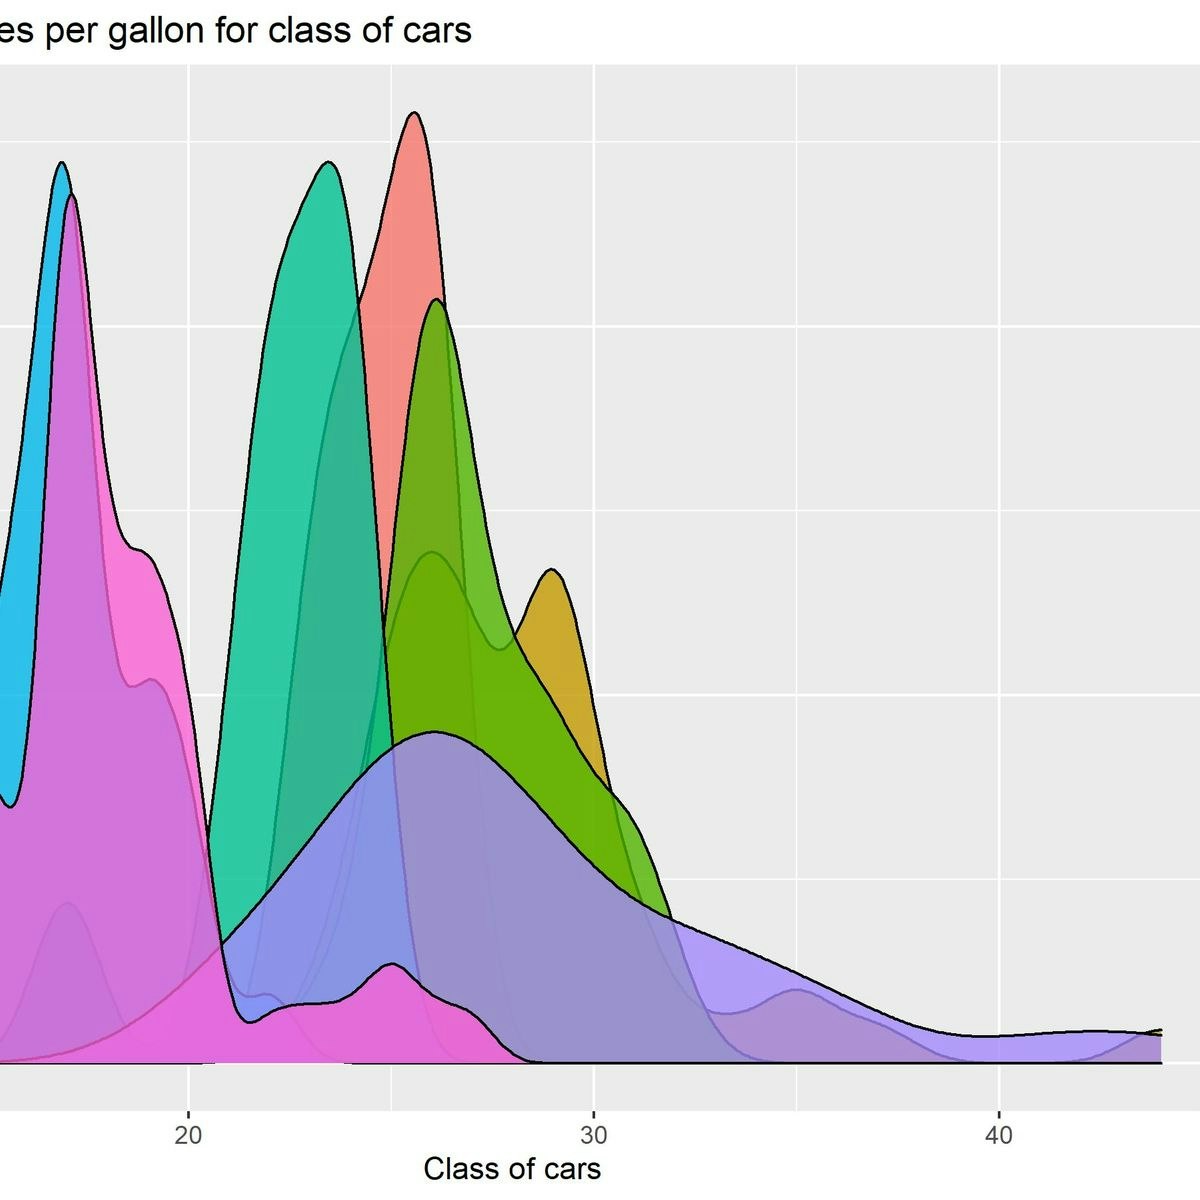
Welcome to this project-based course Introduction to EDA in R. In this project, you will learn how to perform extensive exploratory data analysis on both quantitative and qualitative variables using basic R functions.
By the end of this 2-hour long project, you will understand how to create different basic plots in R. Also, you will learn how to create plots for categorical variables and numeric or quantitative variables. By extension, you will learn how to plot three variables and save your plot as an image in R.
Note, you do not need to be a data scientist to be successful in this guided project, just a familiarity with basic statistics and using R suffice for this project. If you are not familiar with R and want to learn the basics, start with my previous guided projects titled “Getting Started with R” and “Calculating Descriptive Statistics in R”

Stability and Capability in Quality Improvement
In this course, you will learn to analyze data in terms of process stability and statistical control and why having a stable process is imperative prior to perform statistical hypothesis testing. You will create statistical process control charts for both continuous and discrete data using R software. You will analyze data sets for statistical control using control rules based on probability. Additionally, you will learn how to assess a process with respect to how capable it is of meeting specifications, either internal or external, and make decisions about process improvement.
This course can be taken for academic credit as part of CU Boulder’s Master of Science in Data Science (MS-DS) degree offered on the Coursera platform. The MS-DS is an interdisciplinary degree that brings together faculty from CU Boulder’s departments of Applied Mathematics, Computer Science, Information Science, and others. With performance-based admissions and no application process, the MS-DS is ideal for individuals with a broad range of undergraduate education and/or professional experience in computer science, information science, mathematics, and statistics. Learn more about the MS-DS program at https://www.coursera.org/degrees/master-of-science-data-science-boulder.

Generalized Linear Models and Nonparametric Regression
In the final course of the statistical modeling for data science program, learners will study a broad set of more advanced statistical modeling tools. Such tools will include generalized linear models (GLMs), which will provide an introduction to classification (through logistic regression); nonparametric modeling, including kernel estimators, smoothing splines; and semi-parametric generalized additive models (GAMs). Emphasis will be placed on a firm conceptual understanding of these tools. Attention will also be given to ethical issues raised by using complicated statistical models.
This course can be taken for academic credit as part of CU Boulder’s Master of Science in Data Science (MS-DS) degree offered on the Coursera platform. The MS-DS is an interdisciplinary degree that brings together faculty from CU Boulder’s departments of Applied Mathematics, Computer Science, Information Science, and others. With performance-based admissions and no application process, the MS-DS is ideal for individuals with a broad range of undergraduate education and/or professional experience in computer science, information science, mathematics, and statistics. Learn more about the MS-DS program at https://www.coursera.org/degrees/master-of-science-data-science-boulder.
Logo adapted from photo by Vincent Ledvina on Unsplash
Using SAS Viya REST APIs with Python and R
SAS Viya is an in-memory distributed environment used to analyze big data quickly and efficiently. In this course, you’ll learn how to use the SAS Viya APIs to take control of SAS Cloud Analytic Services from a Jupyter Notebook using R or Python. You’ll learn to upload data into the cloud, analyze data, and create predictive models with SAS Viya using familiar open source functionality via the SWAT package -- the SAS Scripting Wrapper for Analytics Transfer. You’ll learn how to create both machine learning and deep learning models to tackle a variety of data sets and complex problems. And once SAS Viya has done the heavy lifting, you’ll be able to download data to the client and use native open source syntax to compare results and create graphics.

Probability Theory: Foundation for Data Science
Understand the foundations of probability and its relationship to statistics and data science. We’ll learn what it means to calculate a probability, independent and dependent outcomes, and conditional events. We’ll study discrete and continuous random variables and see how this fits with data collection. We’ll end the course with Gaussian (normal) random variables and the Central Limit Theorem and understand its fundamental importance for all of statistics and data science.
This course can be taken for academic credit as part of CU Boulder’s Master of Science in Data Science (MS-DS) degree offered on the Coursera platform. The MS-DS is an interdisciplinary degree that brings together faculty from CU Boulder’s departments of Applied Mathematics, Computer Science, Information Science, and others. With performance-based admissions and no application process, the MS-DS is ideal for individuals with a broad range of undergraduate education and/or professional experience in computer science, information science, mathematics, and statistics. Learn more about the MS-DS program at https://www.coursera.org/degrees/master-of-science-data-science-boulder
Logo adapted from photo by Christopher Burns on Unsplash.

Mastering Data Analysis with Pandas
In this structured series of hands-on guided projects, we will master the fundamentals of data analysis and manipulation with Pandas and Python. Pandas is a super powerful, fast, flexible and easy to use open-source data analysis and manipulation tool. This guided project is the first of a series of multiple guided projects (learning path) that is designed for anyone who wants to master data analysis with pandas.
Note: This course works best for learners who are based in the North America region. We’re currently working on providing the same experience in other regions.

Robot Localization with Python and Particle Filters
In this one hour long project-based course, you will tackle a real-world problem in robotics. We will be simulating a robot that can move around in an unknown environment, and have it discover its own location using only a terrain map and an elevation sensor. We will encounter some of the classic challenges that make robotics difficult: noisy sensor data, and imprecise movement.
We will tackle these challenges with an artificial intelligence technique called a particle filter.
By the end of this project, you will have coded a particle filter from scratch using Python and numpy.
Note: This course works best for learners who are based in the North America region. We’re currently working on providing the same experience in other regions.

Regression Models
Linear models, as their name implies, relates an outcome to a set of predictors of interest using linear assumptions. Regression models, a subset of linear models, are the most important statistical analysis tool in a data scientist’s toolkit. This course covers regression analysis, least squares and inference using regression models. Special cases of the regression model, ANOVA and ANCOVA will be covered as well. Analysis of residuals and variability will be investigated. The course will cover modern thinking on model selection and novel uses of regression models including scatterplot smoothing.

Wrangling Data for Data Analysts with Python
By the end of this project, you will be able to analyze and data and answer three different questions by Data wrangling which is the process of gathering, selecting, and transforming data to answer an analytical question using Python. In this project, you will be able to gather the data for the whole year of 2020 and query it from the Quandl website using its API. It’s a free website for dummy data. You will be able to convert the returned JSON data into a Python dictionary. And you will be able to analyze this data to calculate the highest and lowest prices in this period, the biggest change based on High and Low price during this year, And finally, the average makeover during this year.
This guided project is for people in the field of business and data analysis. people who want to wrangle data and answer business questions and Clarify the use case and predict the relations between the source data. It provides you with important steps to be a data analyst. Moreover, it equips you with the knowledge in python's native data structures
Note: This course works best for learners who are based in the North America region. We’re currently working on providing the same experience in other regions.
Popular Internships and Jobs by Categories
Find Jobs & Internships
Browse
© 2024 BoostGrad | All rights reserved