Back to Courses


Probability And Statistics Courses - Page 3
Showing results 21-30 of 133
Exploring and Producing Data for Business Decision Making
This course provides an analytical framework to help you evaluate key problems in a structured fashion and will equip you with tools to better manage the uncertainties that pervade and complicate business processes. Specifically, you will learn how to summarize data and learn concepts of frequency, normal distribution, statistical studies, sampling, and confidence intervals.
While you will be introduced to some of the science of what is being taught, the focus will be on applying the methodologies. This will be accomplished through the use of Excel and data sets from different disciplines, allowing you to see the use of statistics in a range of settings. The course will focus not only on explaining these concepts, but also understanding and interpreting the results obtained.
You will be able to:
• Summarize large data sets in graphical, tabular, and numerical forms
• Understand the significance of proper sampling and why one can rely on sample information
• Understand why normal distribution can be used in a wide range of settings
• Use sample information to make inferences about the population with a certain level of confidence about the accuracy of the estimations
• Use Excel for statistical analysis
This course is part of Gies College of Business’ suite of online programs, including the iMBA and iMSM. Learn more about admission into these programs and explore how your Coursera work can be leveraged if accepted into a degree program at https://degrees.giesbusiness.illinois.edu/idegrees/.

Causal Inference 2
This course offers a rigorous mathematical survey of advanced topics in causal inference at the Master’s level.
Inferences about causation are of great importance in science, medicine, policy, and business. This course provides an introduction to the statistical literature on causal inference that has emerged in the last 35-40 years and that has revolutionized the way in which statisticians and applied researchers in many disciplines use data to make inferences about causal relationships.
We will study advanced topics in causal inference, including mediation, principal stratification, longitudinal causal inference, regression discontinuity, interference, and fixed effects models.

Hypothesis Testing in Public Health
Biostatistics is an essential skill for every public health researcher because it provides a set of precise methods for extracting meaningful conclusions from data. In this second course of the Biostatistics in Public Health Specialization, you'll learn to evaluate sample variability and apply statistical hypothesis testing methods. Along the way, you'll perform calculations and interpret real-world data from the published scientific literature. Topics include sample statistics, the central limit theorem, confidence intervals, hypothesis testing, and p values.

A Crash Course in Causality: Inferring Causal Effects from Observational Data
We have all heard the phrase “correlation does not equal causation.” What, then, does equal causation? This course aims to answer that question and more!
Over a period of 5 weeks, you will learn how causal effects are defined, what assumptions about your data and models are necessary, and how to implement and interpret some popular statistical methods. Learners will have the opportunity to apply these methods to example data in R (free statistical software environment).
At the end of the course, learners should be able to:
1. Define causal effects using potential outcomes
2. Describe the difference between association and causation
3. Express assumptions with causal graphs
4. Implement several types of causal inference methods (e.g. matching, instrumental variables, inverse probability of treatment weighting)
5. Identify which causal assumptions are necessary for each type of statistical method
So join us.... and discover for yourself why modern statistical methods for estimating causal effects are indispensable in so many fields of study!

Building Similarity Based Recommendation System
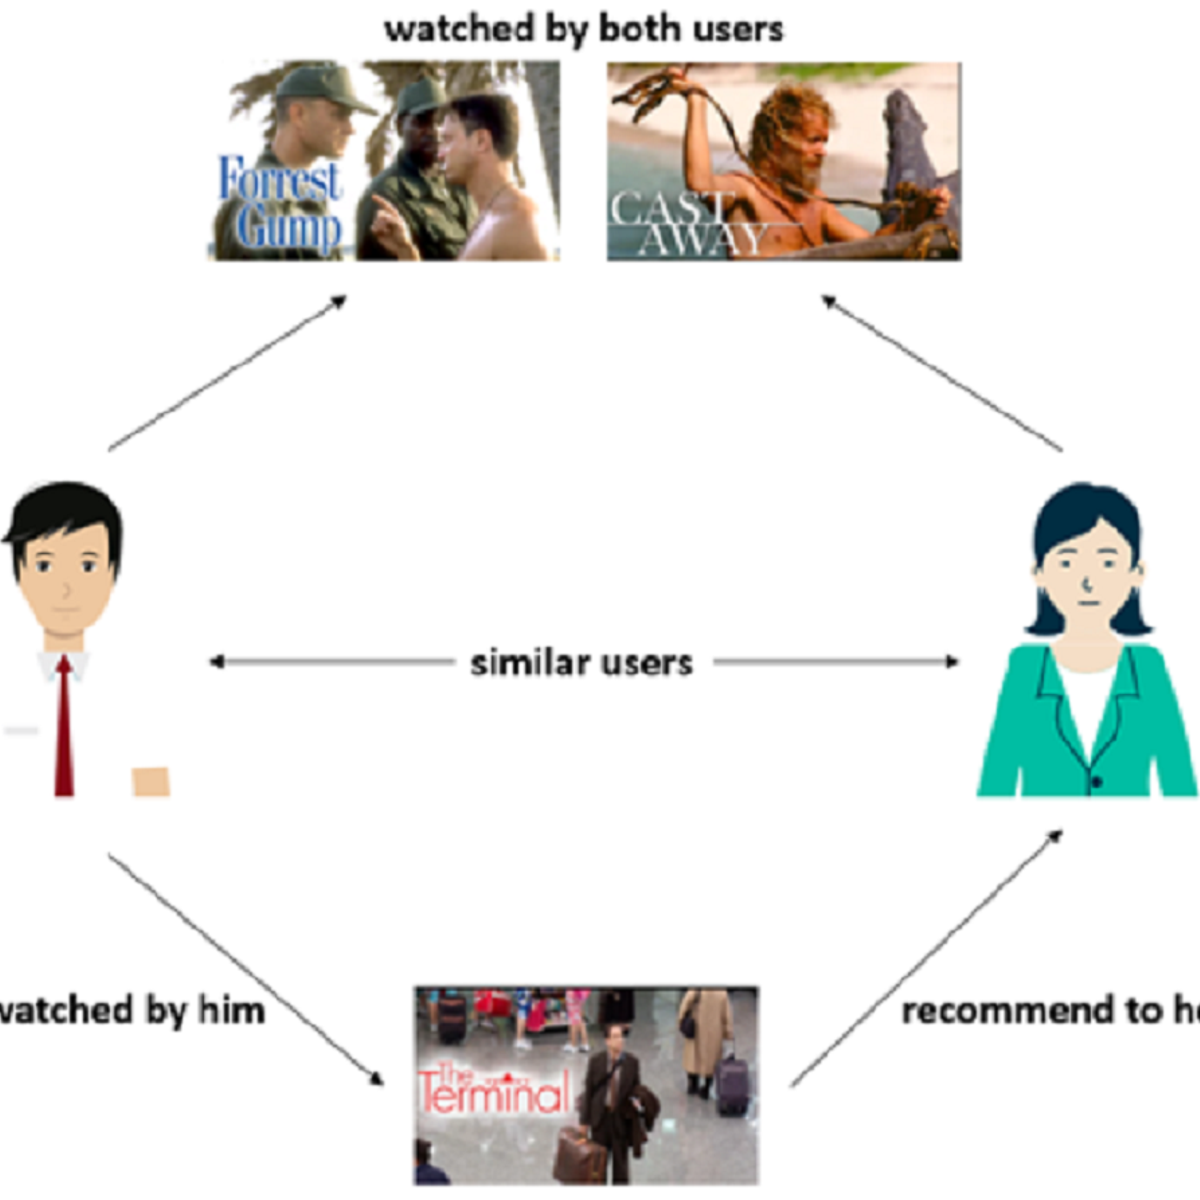
Welcome to this 1-hour project-based course on Building Similarity Based Recommendation System. In this project, you will learn how similarity based collaborative filtering recommendation systems work, how you can collect data for building such systems. You will learn what are some different ways you to compute similarity between users and recommend items based on products interacted by other similar users. You will learn to create user item interactions matrix from the original dataset and also how to recommend items to a new user who does not have any historical interactions with the items.
Note: This course works best for learners who are based in the North America region. We’re currently working on providing the same experience in other regions.

Mathematical Biostatistics Boot Camp 2
Learn fundamental concepts in data analysis and statistical inference, focusing on one and two independent samples.

Mastering Data Analysis with Pandas: Learning Path Part 3
In this structured series of hands-on guided projects, we will master the fundamentals of data analysis and manipulation with Pandas and Python. Pandas is a super powerful, fast, flexible and easy to use open-source data analysis and manipulation tool. This guided project is the third of a series of multiple guided projects (learning path) that is designed for anyone who wants to master data analysis with pandas.
Note: This course works best for learners who are based in the North America region. We’re currently working on providing the same experience in other regions.

Portfolio Diversification using Correlation Matrix
By the end of the project, you will be able to apply correlation matrix in portfolio diversification.
ATTENTION: To take this course, it is required that you are familiar basic financial risk management concepts. You can gain them by taking the guided project Compare Stock Returns with Google Sheets.
Note: This course works best for learners who are based in the North America region. We're currently working on providing the same experience in other regions.
This course's content is not intended to be investment advice and does not constitute an offer to perform any operations in the regulated or unregulated financial market

Object Localization with TensorFlow
Welcome to this 2 hour long guided project on creating and training an Object Localization model with TensorFlow. In this guided project, we are going to use TensorFlow's Keras API to create a convolutional neural network which will be trained to classify as well as localize emojis in images. Localization, in this context, means the position of the emojis in the images. This means that the network will have one input and two outputs. Think of this task as a simpler version of Object Detection. In Object Detection, we might have multiple objects in the input images, and an object detection model predicts the classes as well as bounding boxes for all of those objects. In Object Localization, we are working with the assumption that there is just one object in any given image, and our CNN model will classify and localize that object.
Please note that you will need prior programming experience in Python. You will also need familiarity with TensorFlow. This is a practical, hands on guided project for learners who already have theoretical understanding of Neural Networks, Convolutional Neural Networks, and optimization algorithms like Gradient Descent but want to understand how to use use TensorFlow to solve computer vision tasks like Object Localization.

Statistics for Data Science with Python
This Statistics for Data Science course is designed to introduce you to the basic principles of statistical methods and procedures used for data analysis. After completing this course you will have practical knowledge of crucial topics in statistics including - data gathering, summarizing data using descriptive statistics, displaying and visualizing data, examining relationships between variables, probability distributions, expected values, hypothesis testing, introduction to ANOVA (analysis of variance), regression and correlation analysis. You will take a hands-on approach to statistical analysis using Python and Jupyter Notebooks – the tools of choice for Data Scientists and Data Analysts.
At the end of the course, you will complete a project to apply various concepts in the course to a Data Science problem involving a real-life inspired scenario and demonstrate an understanding of the foundational statistical thinking and reasoning. The focus is on developing a clear understanding of the different
approaches for different data types, developing an intuitive understanding, making appropriate assessments of the proposed methods, using Python to analyze our data, and interpreting the output accurately.
This course is suitable for a variety of professionals and students intending to start their journey in data and statistics-driven roles such as Data Scientists, Data Analysts, Business Analysts, Statisticians, and Researchers. It does not require any computer science or statistics background. We strongly recommend taking the Python for Data Science course before starting this course to get familiar with the Python programming language, Jupyter notebooks, and libraries. An optional refresher on Python is also provided.
After completing this course, a learner will be able to:
✔Calculate and apply measures of central tendency and measures of dispersion to grouped and ungrouped data.
✔Summarize, present, and visualize data in a way that is clear, concise, and provides a practical insight for non-statisticians needing the results.
✔Identify appropriate hypothesis tests to use for common data sets.
✔Conduct hypothesis tests, correlation tests, and regression analysis.
✔Demonstrate proficiency in statistical analysis using Python and Jupyter Notebooks.
Popular Internships and Jobs by Categories
Find Jobs & Internships
Browse
© 2024 BoostGrad | All rights reserved