Back to Courses


Probability And Statistics Courses - Page 2
Showing results 11-20 of 133
Logistic Regression in R for Public Health
Welcome to Logistic Regression in R for Public Health!
Why logistic regression for public health rather than just logistic regression? Well, there are some particular considerations for every data set, and public health data sets have particular features that need special attention. In a word, they're messy. Like the others in the series, this is a hands-on course, giving you plenty of practice with R on real-life, messy data, with predicting who has diabetes from a set of patient characteristics as the worked example for this course. Additionally, the interpretation of the outputs from the regression model can differ depending on the perspective that you take, and public health doesn’t just take the perspective of an individual patient but must also consider the population angle. That said, much of what is covered in this course is true for logistic regression when applied to any data set, so you will be able to apply the principles of this course to logistic regression more broadly too.
By the end of this course, you will be able to:
Explain when it is valid to use logistic regression
Define odds and odds ratios
Run simple and multiple logistic regression analysis in R and interpret the output
Evaluate the model assumptions for multiple logistic regression in R
Describe and compare some common ways to choose a multiple regression model
This course builds on skills such as hypothesis testing, p values, and how to use R, which are covered in the first two courses of the Statistics for Public Health specialisation. If you are unfamiliar with these skills, we suggest you review Statistical Thinking for Public Health and Linear Regression for Public Health before beginning this course. If you are already familiar with these skills, we are confident that you will enjoy furthering your knowledge and skills in Statistics for Public Health: Logistic Regression for Public Health.
We hope you enjoy the course!
Linear Regression and Modeling
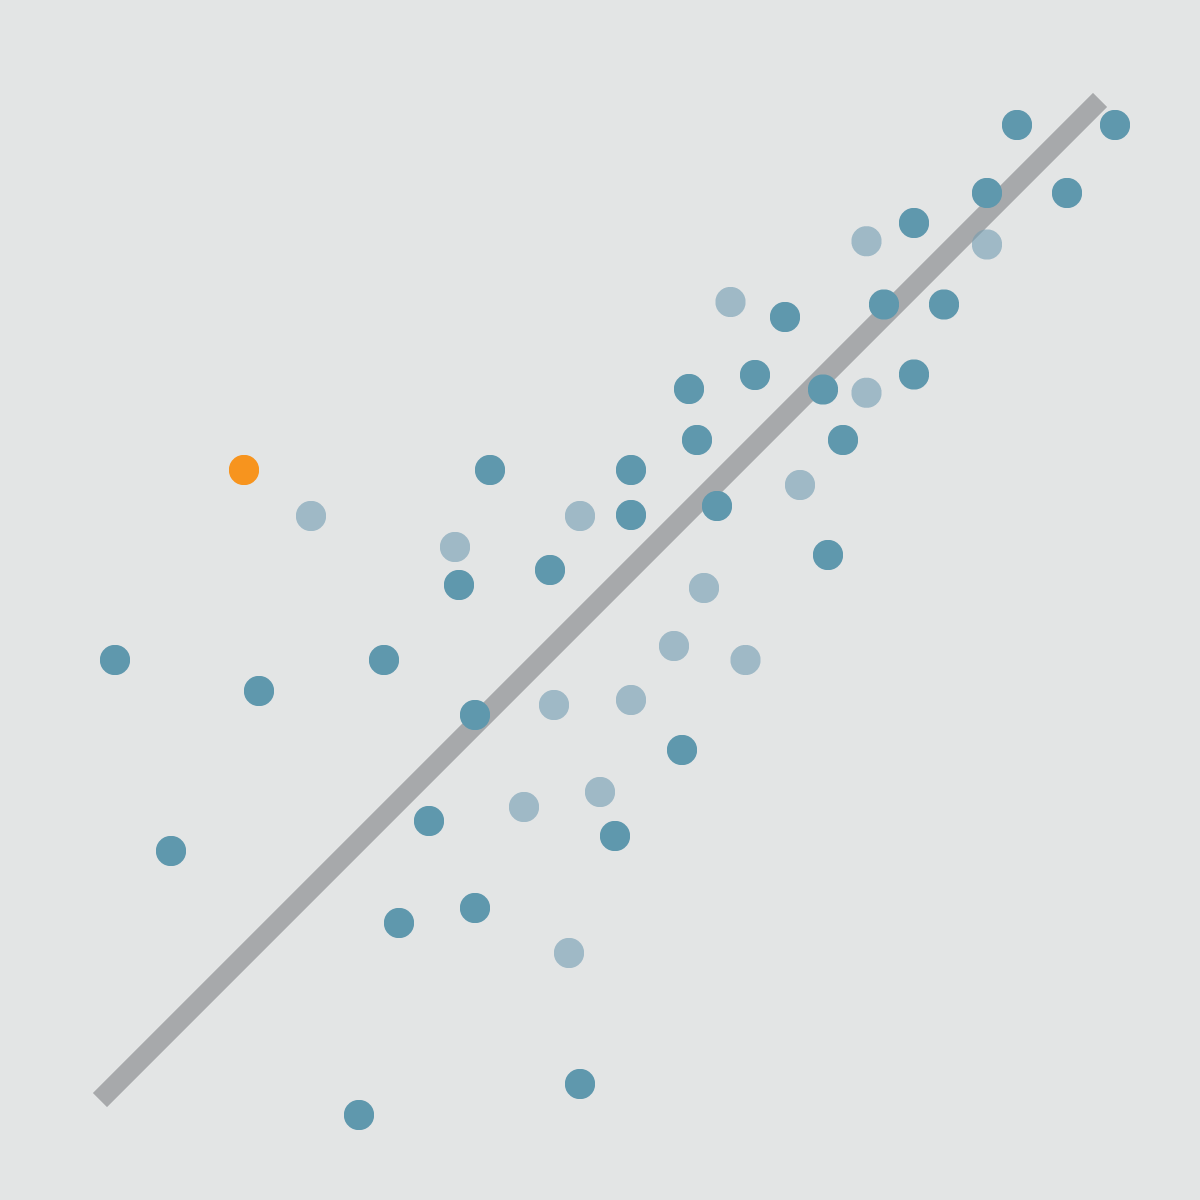
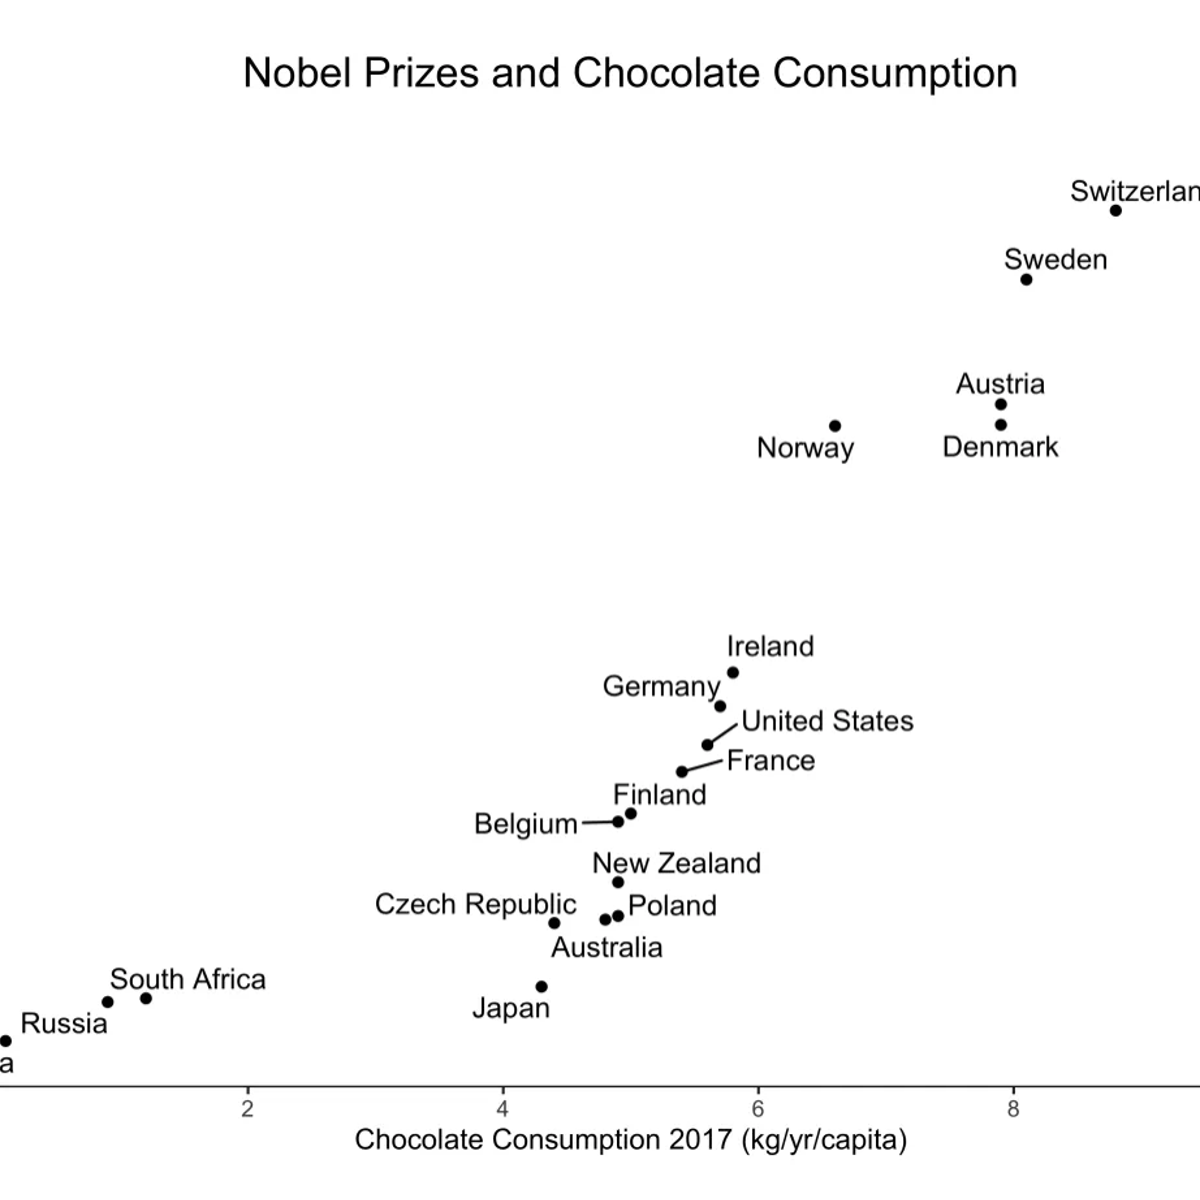
This course introduces simple and multiple linear regression models. These models allow you to assess the relationship between variables in a data set and a continuous response variable. Is there a relationship between the physical attractiveness of a professor and their student evaluation scores? Can we predict the test score for a child based on certain characteristics of his or her mother? In this course, you will learn the fundamental theory behind linear regression and, through data examples, learn to fit, examine, and utilize regression models to examine relationships between multiple variables, using the free statistical software R and RStudio.
Wrangling Data in the Tidyverse
Data never arrive in the condition that you need them in order to do effective data analysis. Data need to be re-shaped, re-arranged, and re-formatted, so that they can be visualized or be inputted into a machine learning algorithm. This course addresses the problem of wrangling your data so that you can bring them under control and analyze them effectively. The key goal in data wrangling is transforming non-tidy data into tidy data.
This course covers many of the critical details about handling tidy and non-tidy data in R such as converting from wide to long formats, manipulating tables with the dplyr package, understanding different R data types, processing text data with regular expressions, and conducting basic exploratory data analyses. Investing the time to learn these data wrangling techniques will make your analyses more efficient, more reproducible, and more understandable to your data science team.
In this specialization we assume familiarity with the R programming language. If you are not yet familiar with R, we suggest you first complete R Programming before returning to complete this course.
Compare Stock Returns with Google Sheets
In this 1-hour long project-based course, you will learn how to compare the performance of different securities using financial statistics (normal distributions) and the Google Sheets toolkit to decide which one performed the best in terms of risk-to-return (risk-to-reward) metrics. This will teach you how basic risk management using quantitative analysis is done and is applied in calculating mean returns of the stock, variance, standard deviation, the Sharpe ratio, and Sortino Ratio.
Note: This course works best for learners who are based in the North America region. We're currently working on providing the same experience in other regions.
This course's content is not intended to be investment advice and does not constitute an offer to perform any operations in the regulated or unregulated financial market.
Essential Causal Inference Techniques for Data Science
Data scientists often get asked questions related to causality: (1) did recent PR coverage drive sign-ups, (2) does customer support increase sales, or (3) did improving the recommendation model drive revenue? Supporting company stakeholders requires every data scientist to learn techniques that can answer questions like these, which are centered around issues of causality and are solved with causal inference.
In this project, you will learn the high level theory and intuition behind the four main causal inference techniques of controlled regression, regression discontinuity, difference in difference, and instrumental variables as well as some techniques at the intersection of machine learning and causal inference that are useful in data science called double selection and causal forests. These will help you rigorously answer questions like those above and become a better data scientist!
ANOVA and Experimental Design
This second course in statistical modeling will introduce students to the study of the analysis of variance (ANOVA), analysis of covariance (ANCOVA), and experimental design. ANOVA and ANCOVA, presented as a type of linear regression model, will provide the mathematical basis for designing experiments for data science applications. Emphasis will be placed on important design-related concepts, such as randomization, blocking, factorial design, and causality. Some attention will also be given to ethical issues raised in experimentation.
This course can be taken for academic credit as part of CU Boulder’s Master of Science in Data Science (MS-DS) degree offered on the Coursera platform. The MS-DS is an interdisciplinary degree that brings together faculty from CU Boulder’s departments of Applied Mathematics, Computer Science, Information Science, and others. With performance-based admissions and no application process, the MS-DS is ideal for individuals with a broad range of undergraduate education and/or professional experience in computer science, information science, mathematics, and statistics. Learn more about the MS-DS program at https://www.coursera.org/degrees/master-of-science-data-science-boulder.
Logo adapted from photo by Vincent Ledvina on Unsplash
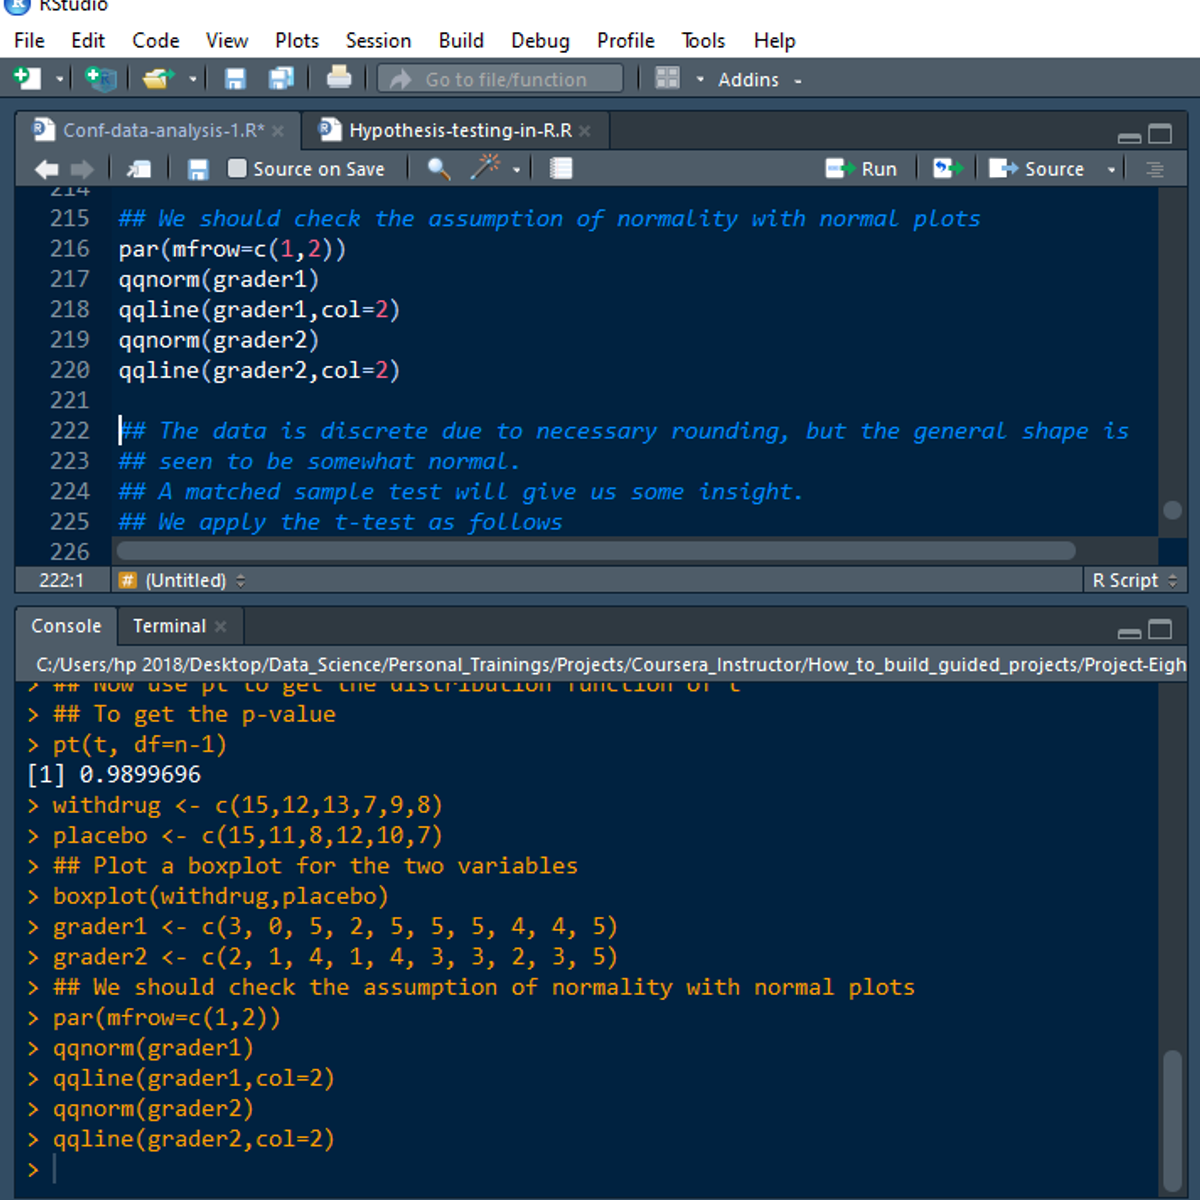
Hypothesis Testing in R
Welcome to this project-based course Hypothesis Testing in R. In this project, you will learn how to perform extensive hypothesis tests for one and two samples in R.
By the end of this 2-hour long project, you will understand the rationale behind performing hypothesis testing. Also, you will learn how to perform hypothesis tests for proportions and means. By extension, you will learn how to perform a hypothesis test for means of matched or paired samples in R.
Note, you do not need to be a statistical analyst or data scientist to be successful in this guided project, just a familiarity with basic statistics and using R suffice for this project. If you are not familiar with R and want to learn the basics, start with my previous guided project titled “Getting Started with R”, and "Calculating Descriptive Statistics in R".
A fundamental prerequisite is having a good understanding of the theory of hypothesis test.
Introduction to Bayesian Statistics
The objective of this course is to introduce Computational Statistics to aspiring or new data scientists. The attendees will start off by learning the basics of probability, Bayesian modeling and inference. This will be the first course in a specialization of three courses .Python and Jupyter notebooks will be used throughout this course to illustrate and perform Bayesian modeling. The course website is located at https://sjster.github.io/introduction_to_computational_statistics/docs/index.html. The course notebooks can be downloaded from this website by following the instructions on page https://sjster.github.io/introduction_to_computational_statistics/docs/getting_started.html.
The instructors for this course will be Dr. Srijith Rajamohan and Dr. Robert Settlage.
BigQuery Machine Learning using Soccer Data
This is a self-paced lab that takes place in the Google Cloud console. Learn how to use BigQuery ML with soccer shot data to create and use an expected goals model.
Bayesian Statistics: Mixture Models
Bayesian Statistics: Mixture Models introduces you to an important class of statistical models. The course is organized in five modules, each of which contains lecture videos, short quizzes, background reading, discussion prompts, and one or more peer-reviewed assignments. Statistics is best learned by doing it, not just watching a video, so the course is structured to help you learn through application.
Some exercises require the use of R, a freely-available statistical software package. A brief tutorial is provided, but we encourage you to take advantage of the many other resources online for learning R if you are interested.
This is an intermediate-level course, and it was designed to be the third in UC Santa Cruz's series on Bayesian statistics, after Herbie Lee's "Bayesian Statistics: From Concept to Data Analysis" and Matthew Heiner's "Bayesian Statistics: Techniques and Models." To succeed in the course, you should have some knowledge of and comfort with calculus-based probability, principles of maximum-likelihood estimation, and Bayesian estimation.
Popular Internships and Jobs by Categories
Find Jobs & Internships
Browse


© 2024 BoostGrad | All rights reserved