Back to Courses


Data Science Courses - Page 21
Showing results 201-210 of 1407
CUDA at Scale for the Enterprise
This course will aid in students in learning in concepts that scale the use of GPUs and the CPUs that manage their use beyond the most common consumer-grade GPU installations. They will learn how to manage asynchronous workflows, sending and receiving events to encapsulate data transfers and control signals. Also, students will walk through application of GPUs to sorting of data and processing images, implementing their own software using these techniques and libraries.
By the end of the course, you will be able to do the following:
- Develop software that can use multiple CPUs and GPUs
- Develop software that uses CUDA’s events and streams capability to create asynchronous workflows
- Use the CUDA computational model to to solve canonical programming challenges including data sorting and image processing
To be successful in this course, you should have an understanding of parallel programming and experience programming in C/C++.
This course will be extremely applicable to software developers and data scientists working in the fields of high performance computing, data processing, and machine learning.
Covid-19 Death Medical Analysis & Visualization using Plotly
In this 2-hour long project-based course, you will learn how to build bar graphs, scatter plots, Choropleth maps and Wordcloud to analyze and visualize the global scenario of Covid-19 and perform medical analysis to various conditions that contribute to death due to Covid-19. We will be using two separate datasets for this guided project. The first dataset has been taken from worldometer and the second one has been made available by the Centers for Disease Control and Prevention (CDC), United States.
We will be using Python as our Programming language and Google Colab as our notebook. It is required for you to have a Gmail Account for this project. It is recommended to have some experience in the Python programming language but even if you do not have any prior experience in Python programming or medical science, you will be able to complete this project. This project is beginner-friendly.
We will visualize the current global scenario of Covid-19 using bar graphs and scatter plots followed by geographical data visualization using Choropleth maps. Then we will dive into medical analysis. We will then visualize how Covid deaths vary with respect to age group and how various pre-existing medical conditions vary with age. Then we will visualize and analyze how various medical conditions contribute to Covid death. We will also compare the performance of all the 50 states in the US against Covid. In the final task, we will finish by creating WordCloud text visualization of various medical conditions and condition groups that contribute to Covid deaths.
Note: This course works best for learners who are based in the North America region. We’re currently working on providing the same experience in other regions.
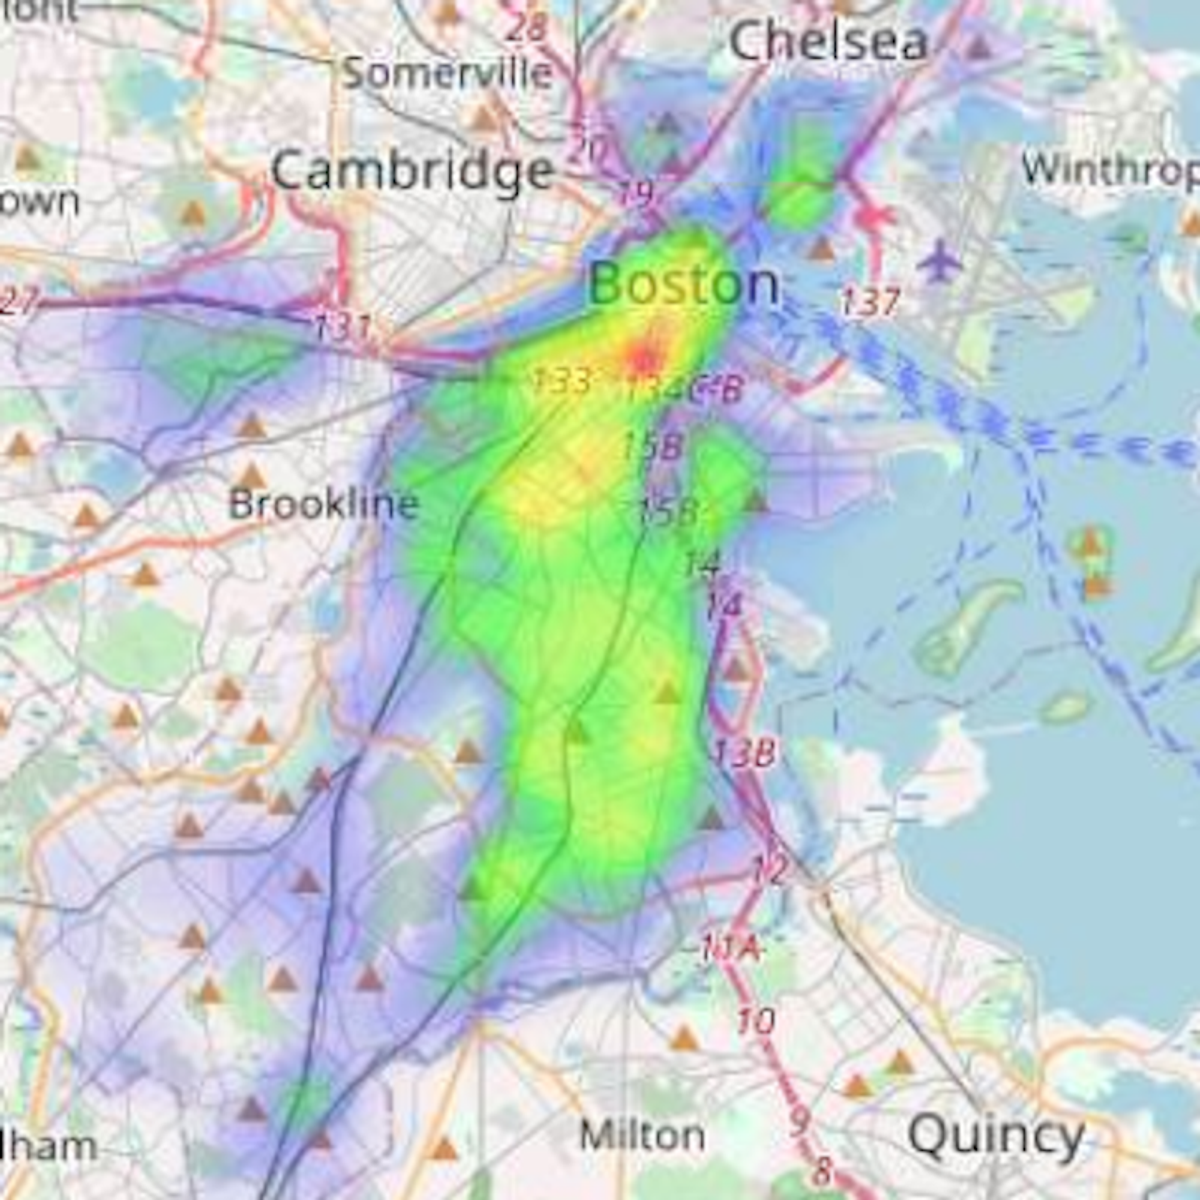
Crime Zone Heatmaps with Python and Folium
In this one hour long project-based course, you will tackle a real-world problem in data analysis and visualization. You will process a dataset of crime incidents in the city of Boston, and use this data to create an animated heatmap displaying crime hotspots.
Heatmaps use color to display a quantity that changes over two dimensions.
By the end of this project, you will have created heatmaps using code you will write in Python.
Working with BigQuery
In this guided project, you will learn about working with Google's BigQuery which is allows easily work with and query massive datasets without worrying about time wasting or having the right infrastructure to analyze that data quickly. You will learn how to use big query to collect your data, query it with SQL and even do quick visualizations on it.
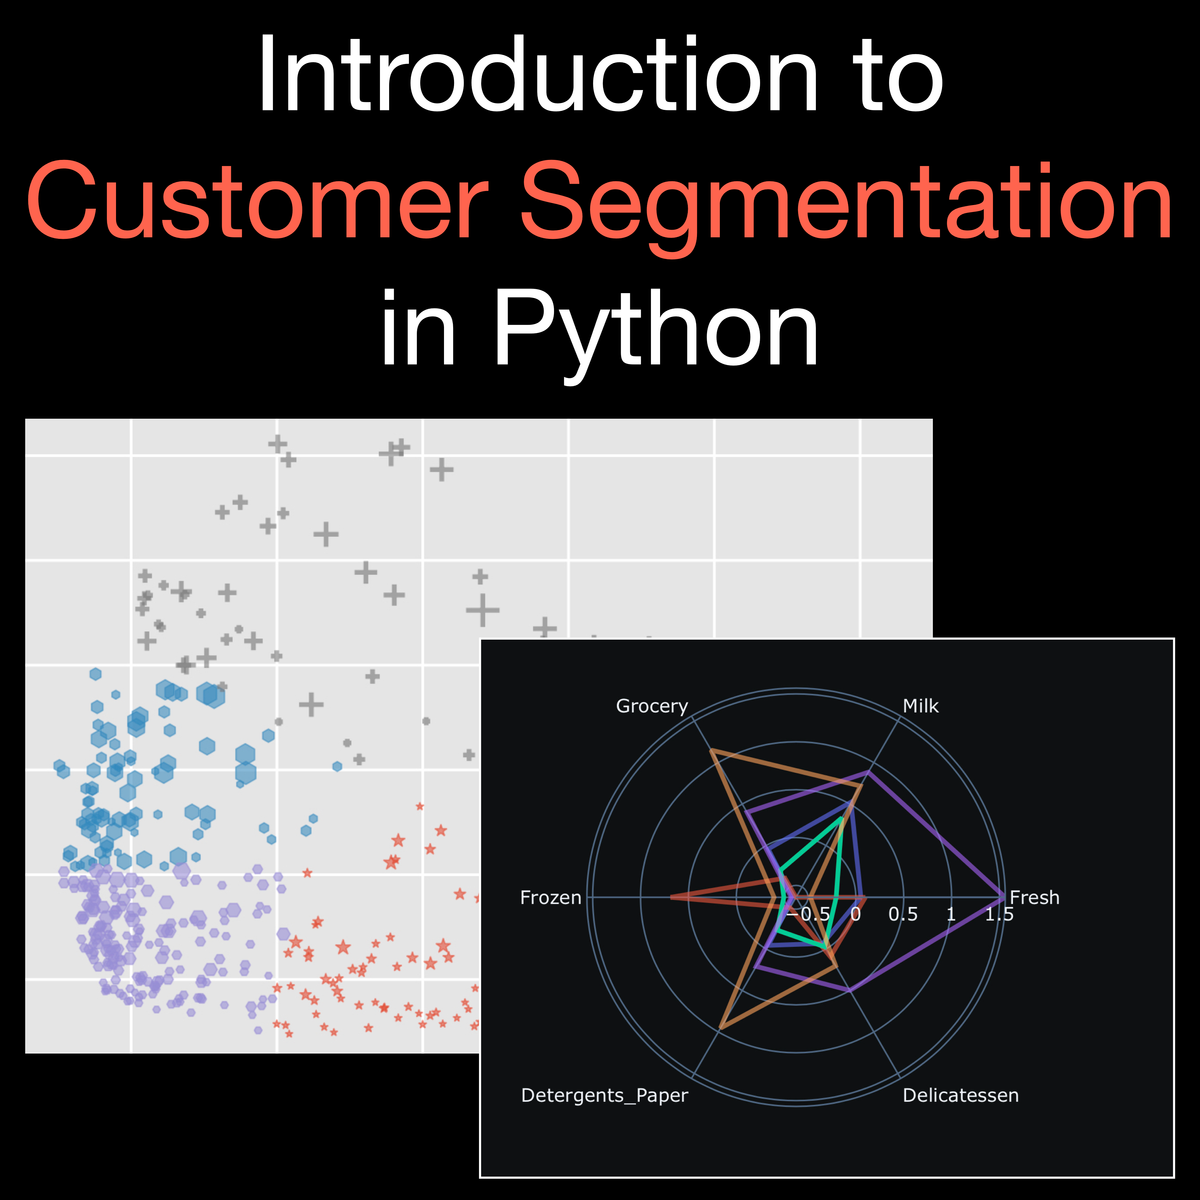
Introduction to Customer Segmentation in Python
In this 2 hour long project, you will learn how to approach a customer purchase dataset, and how to explore the intricacies of such a dataset. You will learn the basic underlying ideas behind Principal Component Analysis, Kernel Principal Component Analysis, and K-Means Clustering. You will learn how to leverage these concepts, paired with industry knowledge and auxiliary modeling concepts to segment the customers of a certain store, and find similarities and differences between different clusters using unsupervised machine learning techniques.
Note: This course works best for learners who are based in the North America region. We’re currently working on providing the same experience in other regions.
Getting Started with SAS Visual Analytics
In this course, you learn more about SAS Visual Analytics and the SAS Viya platform, how to access and investigate data in SAS Visual Analytics, and how to prepare data for analysis using SAS Data Studio.
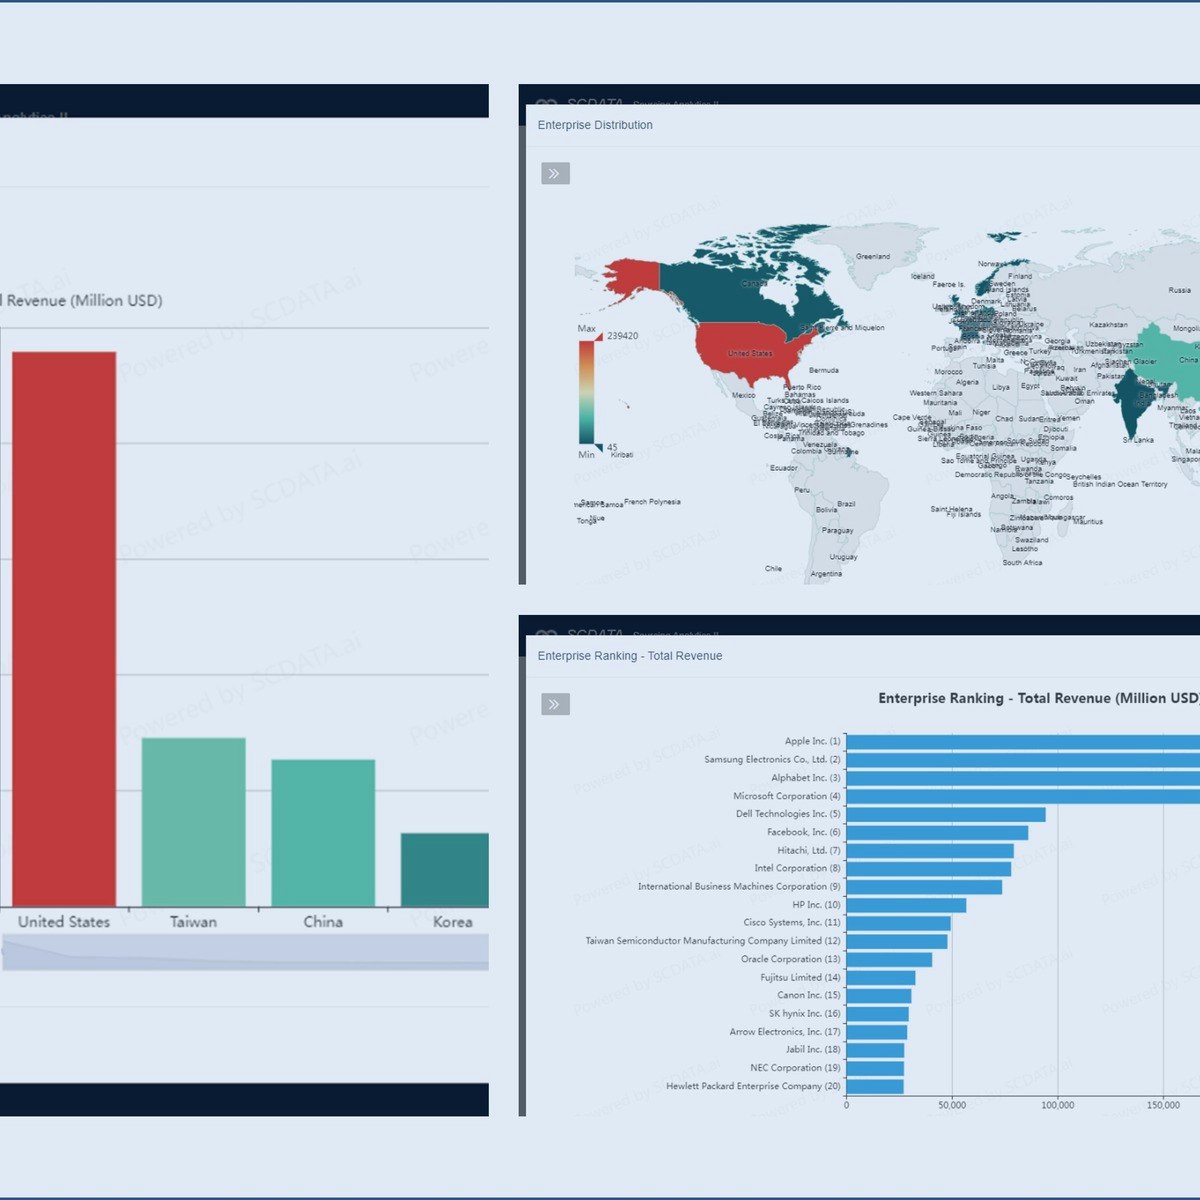
Sourcing Analytics
It is easy to spend money, but hard to get the value.
From 2007 to 2010, Apple made $27 billion from iPhone with a profit of $15.6 billion. Apple could not achieve this success without its global sourcing strategy. However, one of Apple’s key suppliers, Samsung Electronics, became a competitor and used its cost advantage to over-take Apple in the global market. Meanwhile, many new suppliers and products are emerging constantly. To continue the success, Apple must explore the global markets to identify and select new suppliers that are capable, inexpensive and financially robust. The question is, how to do it right for this year?
What Apple experienced is typical in practice, as a company may have thousands of suppliers, and numerous new suppliers and products / services emerge constantly and globally, which requires a frequent adjustment of the supply base.
In this course, you will learn sourcing analytics which applies data analytics and business intelligence to supplier development and management. Specifically, you will learn market intelligence, bargain power analysis, and supplier analysis, to identify and select suppliers with the objective of getting more value with less spend.
Machine Learning for Accounting with Python
This course, Machine Learning for Accounting with Python, introduces machine learning algorithms (models) and their applications in accounting problems. It covers classification, regression, clustering, text analysis, time series analysis. It also discusses model evaluation and model optimization. This course provides an entry point for students to be able to apply proper machine learning models on business related datasets with Python to solve various problems.
Accounting Data Analytics with Python is a prerequisite for this course. This course is running on the same platform (Jupyter Notebook) as that of the prerequisite course. While Accounting Data Analytics with Python covers data understanding and data preparation in the data analytics process, this course covers the next two steps in the process, modeling and model evaluation. Upon completion of the two courses, students should be able to complete an entire data analytics process with Python.
Fundamentals of Cloud Computing
This course is the second of a series that aims to prepare you for a role working in data analytics. In this course, you will be introduced to many of the core concepts of cloud computing. You will learn about the primary deployment models. We’ll go through the common cloud computing service models. The hands on material offers the opportunity to review and configure a cloud account. This course covers a wide variety of topics that are critical for understanding cloud computing and are designed to give you an introduction and overview as you begin to build relevant knowledge and skills.
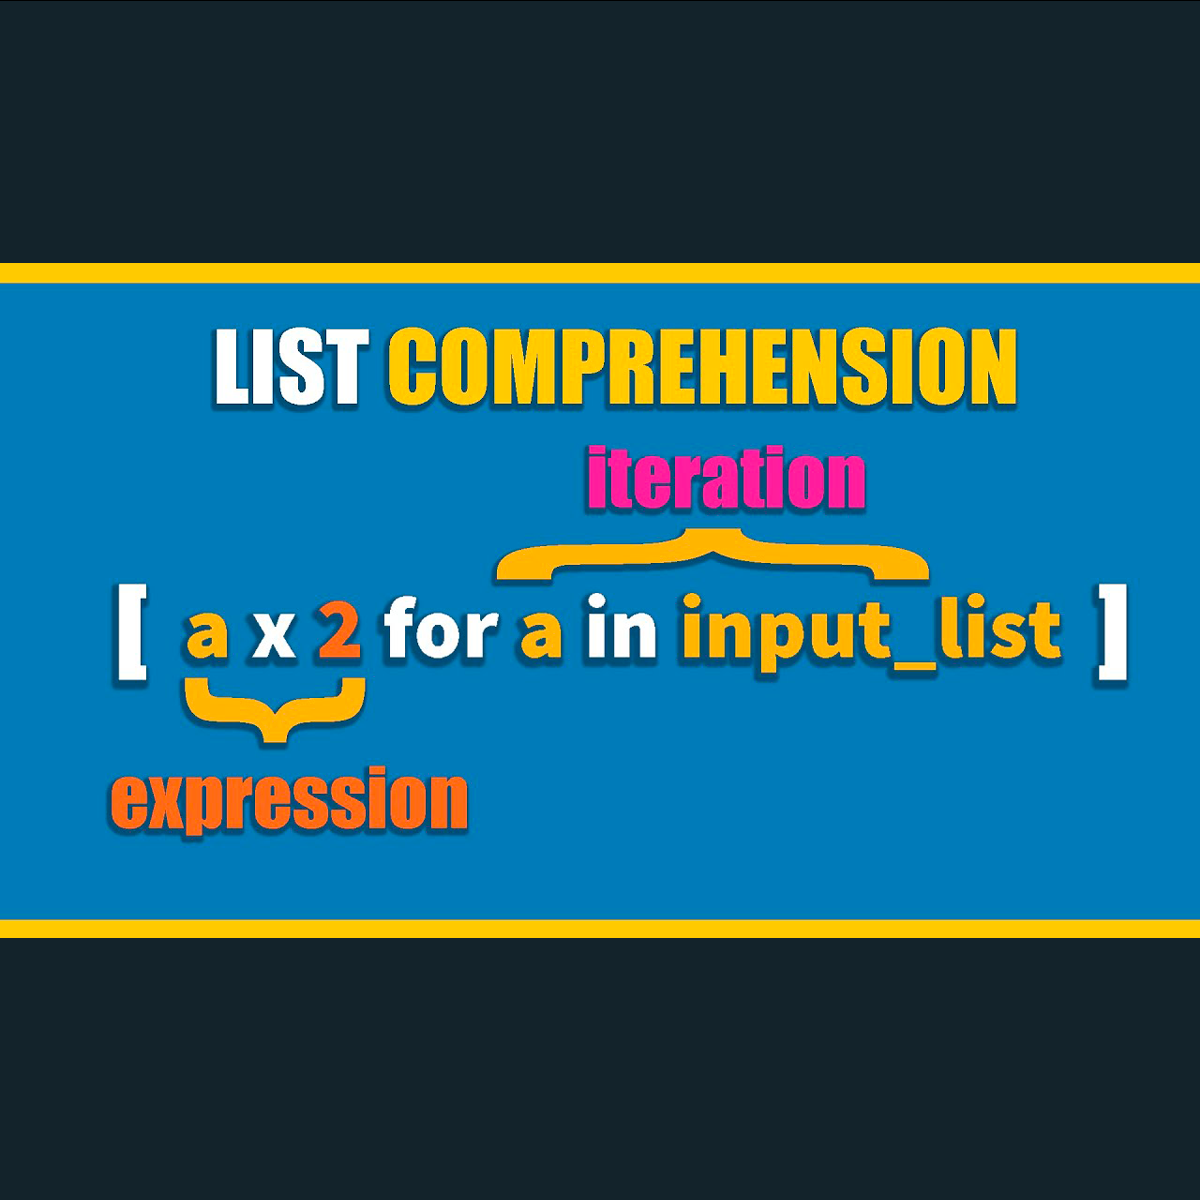
Where, Why, and How of List Comprehension in Python
At the end of this project, you will learn about the Where, Why, and How of List Comprehension in Python. We are going to start with a quick introduction to lists and then we will talk about what list comprehension is and how and where we can use it. In the final task, we will load a JSON dataset containing information about UFO observations reported by civilians around the globe. we are going to use list comprehension to extract useful information out of our data.
Popular Internships and Jobs by Categories
Find Jobs & Internships
Browse


© 2024 BoostGrad | All rights reserved