Back to Courses


Data Science Courses - Page 20
Showing results 191-200 of 1407
Use Python and Java to Create a GUI Application
By the end of this project, you will implement a Java GUI to read from a user-provided file containing data. The GUI will call Python applications to plot columnar data as X and Y coordinates on a regression graph, and display statistics about the data from each of the selected columns.
A graphical user interface can be a nice alternative to using the command line for running programs, as there is no need to memorize how to execute a command with arguments. A label may be added to describe what is needed for the application, for example. There are many choices for building a graphical user interface in Java. Using the Java Swing GUI package is the standard GUI toolkit for Java applications and is widely available on multiple platforms including Windows, Mac, and Linux. The event handlers in Java can then call existing Python applications to analyze the data.
Note: This course works best for learners who are based in the North America region. We’re currently working on providing the same experience in other regions.
AI For Medical Treatment
AI is transforming the practice of medicine. It’s helping doctors diagnose patients more accurately, make predictions about patients’ future health, and recommend better treatments. This Specialization will give you practical experience in applying machine learning to concrete problems in medicine.
Medical treatment may impact patients differently based on their existing health conditions. In this third course, you’ll recommend treatments more suited to individual patients using data from randomized control trials. In the second week, you’ll apply machine learning interpretation methods to explain the decision-making of complex machine learning models. Finally, you’ll use natural language entity extraction and question-answering methods to automate the task of labeling medical datasets.
These courses go beyond the foundations of deep learning to teach you the nuances in applying AI to medical use cases. If you are new to deep learning or want to get a deeper foundation of how neural networks work, we recommend that you take the Deep Learning Specialization.
Data Integration with Microsoft Azure Data Factory
In this course, you will learn how to create and manage data pipelines in the cloud using Azure Data Factory.
This course is part of a Specialization intended for Data engineers and developers who want to demonstrate their expertise in designing and implementing data solutions that use Microsoft Azure data services. It is ideal for anyone interested in preparing for the DP-203: Data Engineering on Microsoft Azure exam (beta).
This is the third course in a program of 10 courses to help prepare you to take the exam so that you can have expertise in designing and implementing data solutions that use Microsoft Azure data services. The Data Engineering on Microsoft Azure exam is an opportunity to prove knowledge expertise in integrating, transforming, and consolidating data from various structured and unstructured data systems into structures that are suitable for building analytics solutions that use Microsoft Azure data services. Each course teaches you the concepts and skills that are measured by the exam.
By the end of this Specialization, you will be ready to take and sign-up for the Exam DP-203: Data Engineering on Microsoft Azure (beta).
Introduction to Python Fundamentals
How many times have you decided to learn a programming language but got stuck somewhere along the way, grew frustrated, and gave up? This specialization is designed for learners who have little or no programming experience but want to use Python as a tool to play with data.
The first course will introduce you to programming languages, with Python as an example. You are going to learn how to use variables and operators, as well as input/output and flow controls to build simple Python programs. The pace will be very slow, so you will feel comfortable learning Python as quickly or as slowly as you like.
Are you ready? Let's go!
Logo image courtesy of Mourizal Zativa. Available on Unsplash here: https://unsplash.com/photos/gNMVpAPe3PE
Using BigQuery in the Google Cloud Console
This is a self-paced lab that takes place in the Google Cloud console.
This lab shows you how to query public tables and load sample data into BigQuery using the GCP Console. Watch the following short video Get Meaningful Insights with Google BigQuery.
Data Science for Business Innovation
The Data Science for Business Innovation nano-course is a compendium of the must-have expertise in data science for executives and middle-management to foster data-driven innovation. The course explains what Data Science is and why it is so hyped.
You will learn:
* the value that Data Science can create
* the main classes of problems that Data Science can solve
* the difference is between descriptive, predictive, and prescriptive analytics
* the roles of machine learning and artificial intelligence.
From a more technical perspective, the course covers supervised, unsupervised and semi-supervised methods, and explains what can be obtained with classification, clustering, and regression techniques. It discusses the role of NoSQL data models and technologies, and the role and impact of scalable cloud-based computation platforms. All topics are covered with example-based lectures, discussing use cases, success stories, and realistic examples.
Following this nano-course, if you wish to further deepen your data science knowledge, you can attend the Data Science for Business Innovation live course https://professionalschool.eitdigital.eu/data-science-for-business-innovation
Judgmental Business Forecasting in Excel
In this course, we extend your business forecasting expertise from the first two courses of our Business Forecasting Specialisation on Time Series Models and Regression Models. We will explore the role of judgmental forecasting, when more quantitative forecasting methods have limitations, and we need to generate further business insights. We will be exploring some structured methodologies to create judgmental business forecasts using Business Indicators, Subjective Assessment Methods, and Exploratory Methods. For each of these methods, we will look at how we can use Excel to help us in achieving these judgmental forecasts and how Excel can help us visualising our forecast findings. Being judgmental forecasting methods, we will also look at the role of biases in Business Forecasting,
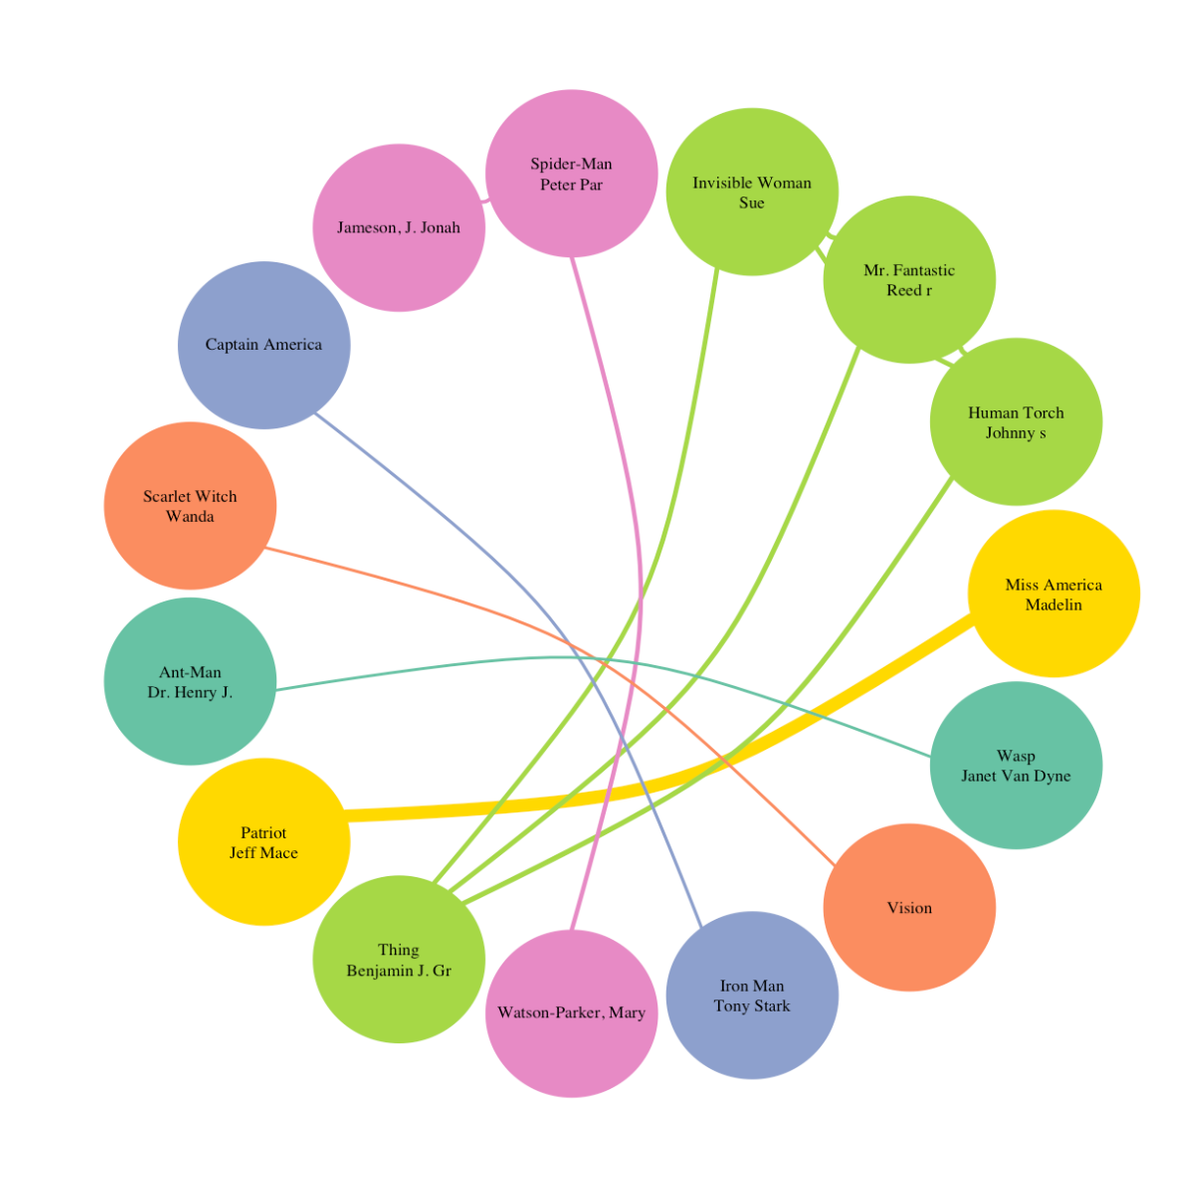
Visualizing static networks with R
In daily life, our connections with family and friends form our social networks. Across the country, roads between different places form transportation networks. In research areas, collaborations among different researchers form research collaboration networks. Visible or invisible, networks exist in many aspects of our life. Being able to visualize networks will help us understand relationships embedded in complicated network information.
In this project, learners will visualize various types of static networks of marvel heroes using the igraph package and base R plot functions. We can easily use static networks in reports and presentations. A good handle of this method will help learners, from both academia and industry, quickly express informative relationships and connections among different variables.
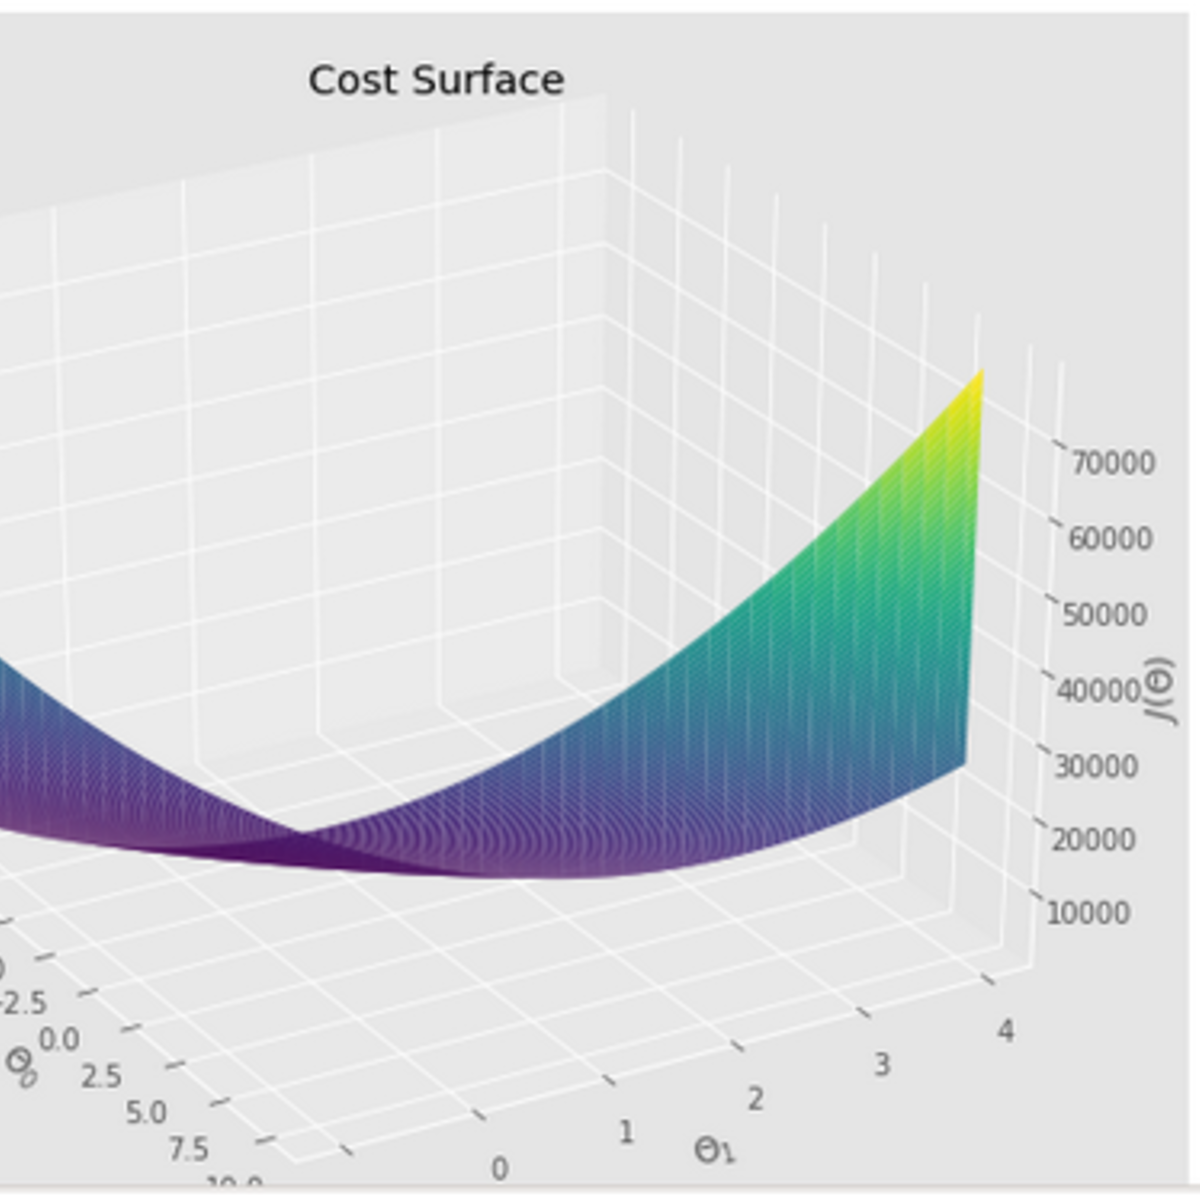
Linear Regression with NumPy and Python
Welcome to this project-based course on Linear Regression with NumPy and Python. In this project, you will do all the machine learning without using any of the popular machine learning libraries such as scikit-learn and statsmodels. The aim of this project and is to implement all the machinery, including gradient descent and linear regression, of the various learning algorithms yourself, so you have a deeper understanding of the fundamentals.
This course runs on Coursera's hands-on project platform called Rhyme. On Rhyme, you do projects in a hands-on manner in your browser. You will get instant access to pre-configured cloud desktops containing all of the software and data you need for the project. Everything is already set up directly in your internet browser so you can just focus on learning. For this project, you’ll get instant access to a cloud desktop with Python, Jupyter, NumPy, and Seaborn pre-installed.
App Dev: Storing Application Data in Cloud Datastore - Python
This is a self-paced lab that takes place in the Google Cloud console.
In this lab, you will review the case study application, an online Quiz. You will store application data for the Quiz application in Cloud Datastore.
Popular Internships and Jobs by Categories
Find Jobs & Internships
Browse


© 2024 BoostGrad | All rights reserved