Visualizing static networks with R
Overview
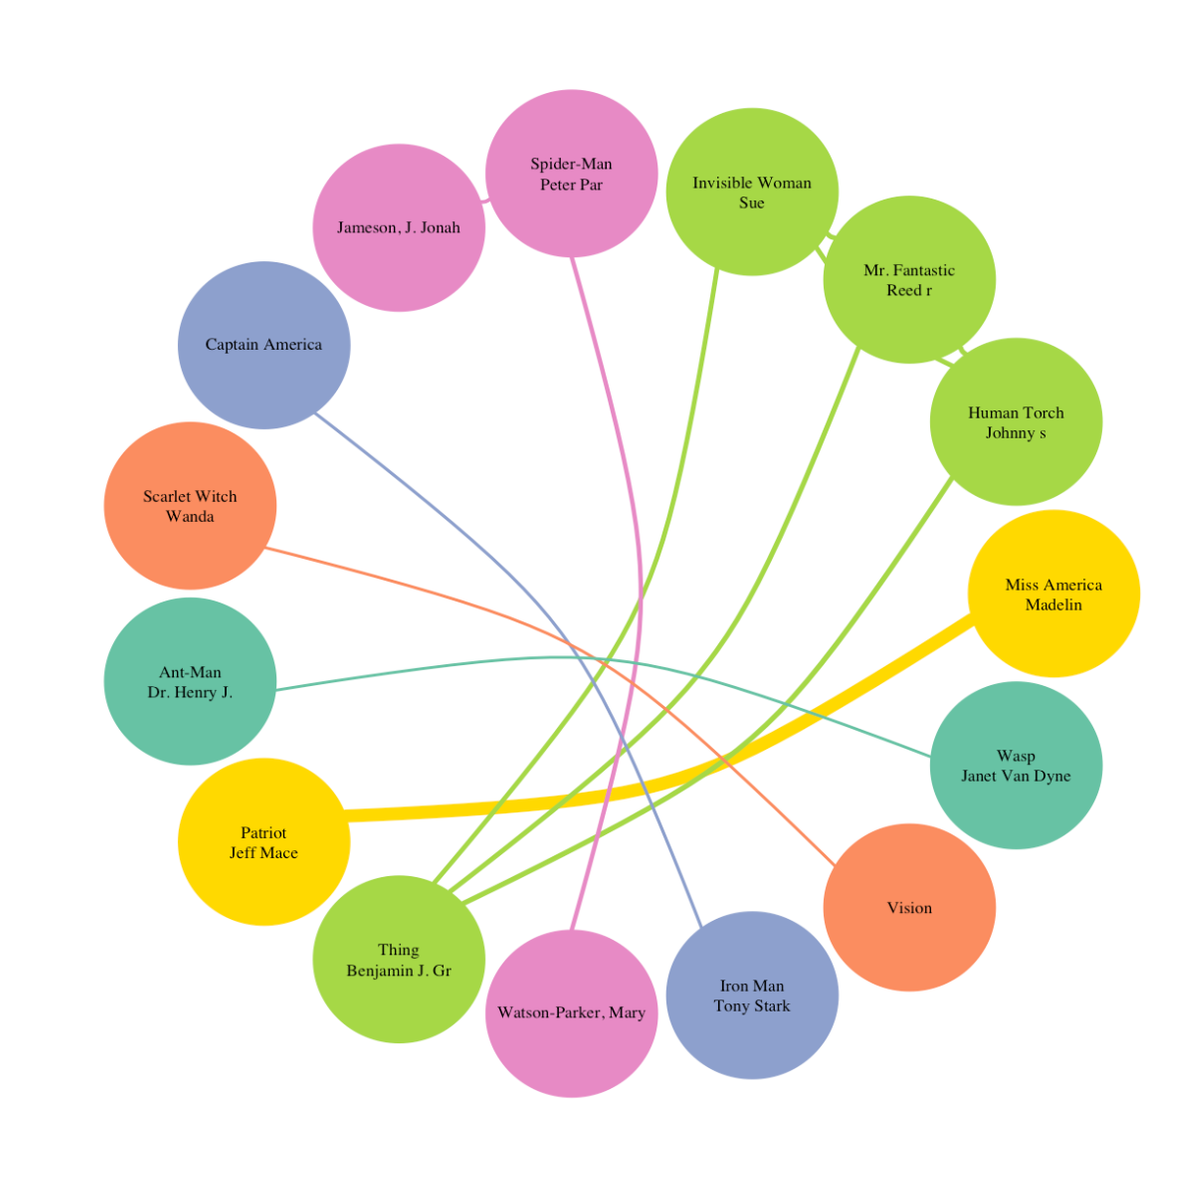
In daily life, our connections with family and friends form our social networks. Across the country, roads between different places form transportation networks. In research areas, collaborations among different researchers form research collaboration networks. Visible or invisible, networks exist in many aspects of our life. Being able to visualize networks will help us understand relationships embedded in complicated network information. In this project, learners will visualize various types of static networks of marvel heroes using the igraph package and base R plot functions. We can easily use static networks in reports and presentations. A good handle of this method will help learners, from both academia and industry, quickly express informative relationships and connections among different variables.

Download the app