Back to Courses


Data Science Courses - Page 19
Showing results 181-190 of 1407
Bayesian Inference with MCMC
The objective of this course is to introduce Markov Chain Monte Carlo Methods for Bayesian modeling and inference, The attendees will start off by learning the the basics of Monte Carlo methods. This will be augmented by hands-on examples in Python that will be used to illustrate how these algorithms work. This will be the second course in a specialization of three courses .Python and Jupyter notebooks will be used throughout this course to illustrate and perform Bayesian modeling with PyMC3. The course website is located at https://sjster.github.io/introduction_to_computational_statistics/docs/index.html. The course notebooks can be downloaded from this website by following the instructions on page https://sjster.github.io/introduction_to_computational_statistics/docs/getting_started.html.
The instructor for this course will be Dr. Srijith Rajamohan.
OpenVINO Beginner: Building a Crossroad AI Camera
In this 2-hour long project-based course, you will learn how to Build a Crossroad AI Camera:
Learning Objective 1: By the end of Task 1, you will be able to explain the OpenVINO™ Toolkit Workflow and OpenVINO™ Toolkit Components
Learning Objective 2: By the end of Task 2, you will be able to operationalize models using the Model Downloader utility
Learning Objective 3: By the end of Task 3, you will be able to perform Model Preparation, Conversion and Optimization
Learning Objective 4: By the end of Task 4, you will be able to Running and Tuning Inference
Learning Objective 5: By the end of Task 5, you will be able to create visualization of Person Attributes and Person Re-identification (REID) information for each detected person in an Image/Video/Camera input.
Getting Started with Tensorflow.js
By the end of this project, you will learn how to code a smart webcam to detect people and other everyday objects using a pre-trained COCO-SSD image recognition model with Tensorflow.js.
Based on an older library called deeplearn.js, Tensorflow.js is a deep learning library that leverages Tensorflow to create, train and run inference on artificial neural network models directly in a web browser, utilizing the client's GPU/CPU resources (accelerated using WebGL). Tensorflow.js brings Tensorflow to the web!
JavaScript/Typescript experience is heavily recommended.
Note: This course works best for learners who are based in the North America region. We’re currently working on providing the same experience in other regions.
BigQuery Machine Learning using Soccer Data
This is a self-paced lab that takes place in the Google Cloud console. Learn how to use BigQuery ML with soccer shot data to create and use an expected goals model.
Processing Data with Python
Processing data is used in virtually every field these days. It is used for analyzing web traffic to determine personal preferences, gathering scientific data for biological analysis, analyzing weather patterns, business practices, and on. Data can take on many different forms and come from many different sources. Python is an open-source (free) programming language that is used in web programming, data science, artificial intelligence, and many scientific applications. It has libraries that can be used to parse and quickly analyze the data in whatever form it comes in, whether it be in XML, CSV, or JSON format. Data cleaning is an important aspect of processing data, particularly in the field of data science.
Note: This course works best for learners who are based in the North America region. We’re currently working on providing the same experience in other regions.
Amazon Echo Reviews Sentiment Analysis Using NLP
In this hands-on project, we will predict customer sentiment using natural language processing techniques.
In this project, we will build a machine learning model to analyze thousands of amazon echo reviews to predict customers sentiment. Artificial Intelligence and Machine Learning (AI/ML)-based sentiment analysis is crucial for companies to automatically predict whether their customers are happy or not. This project is practical and directly applicable to any company with that has online presence. The algorithm could be used automatically detect customers sentiment.
Note: This course works best for learners who are based in the North America region. We’re currently working on providing the same experience in other regions.
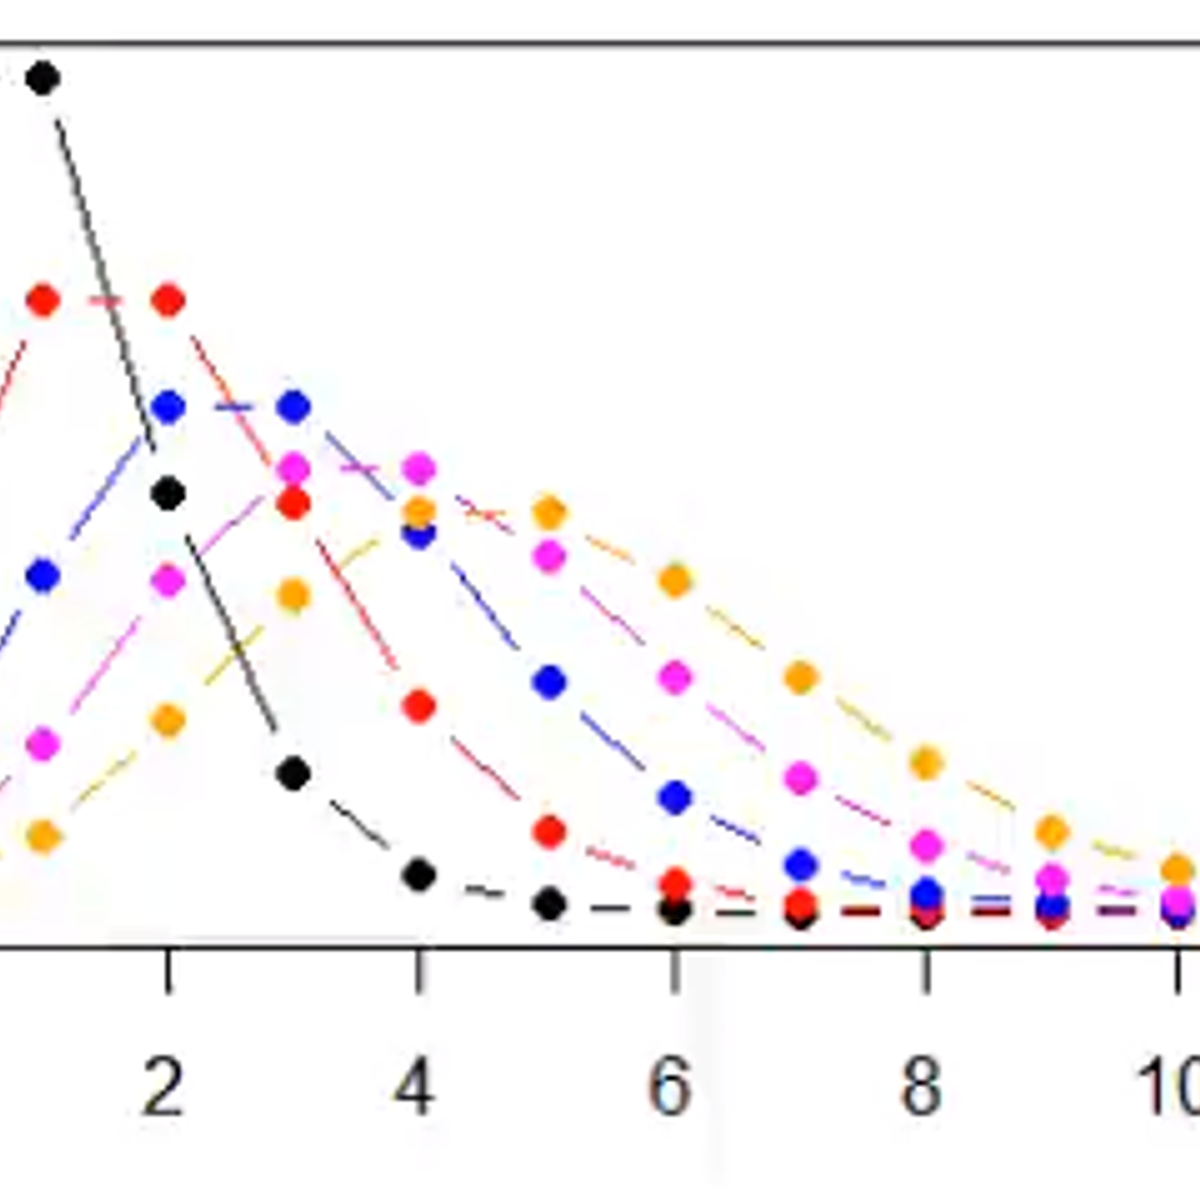
Introduction to Distributions in R
This project is aimed at beginners who have a basic familiarity with the statistical programming language R and the RStudio environment, or people with a small amount of experience who would like to review the fundamentals of generating random numerical data from distributions in R.
Moneyball and Beyond
The book Moneyball triggered a revolution in the analysis of performance statistics in professional sports, by showing that data analytics could be used to increase team winning percentage. This course shows how to program data using Python to test the claims that lie behind the Moneyball story, and to examine the evolution of Moneyball statistics since the book was published. The learner is led through the process of calculating baseball performance statistics from publicly available datasets. The course progresses from the analysis of on base percentage and slugging percentage to more advanced measures derived using the run expectancy matrix, such as wins above replacement (WAR). By the end of this course the learner will be able to use these statistics to conduct their own team and player analyses.
Publication-Ready Tables in R
Learn how to create Publication-Ready Tables in R for descriptive statistics, contingency tables, correlation tables, model summary tables and survival probabilities tables
Perform Feature Analysis with Yellowbrick
Welcome to this project-based course on Performing Feature Analysis with Yellowbrick. In this course, we are going to use visualizations to steer machine learning workflows. The problem we will tackle is to predict whether rooms in apartments are occupied or unoccupied based on passive sensor data such as temperature, humidity, light and CO2 levels. With an emphasis on visual steering of our analysis, we will cover the following topics in our machine learning workflow: feature analysis using methods such as scatter plots, RadViz, parallel coordinates plots, feature ranking, and manifold visualization.
This course runs on Coursera's hands-on project platform called Rhyme. On Rhyme, you do projects in a hands-on manner in your browser. You will get instant access to pre-configured cloud desktops containing all of the software and data you need for the project. Everything is already set up directly in your internet browser so you can just focus on learning. For this project, you’ll get instant access to a cloud desktop with Python, Jupyter, Yellowbrick, and scikit-learn pre-installed.
Notes:
- You will be able to access the cloud desktop 5 times. However, you will be able to access instructions videos as many times as you want.
- This course works best for learners who are based in the North America region. We’re currently working on providing the same experience in other regions.
Popular Internships and Jobs by Categories
Find Jobs & Internships
Browse


© 2024 BoostGrad | All rights reserved