Back to Courses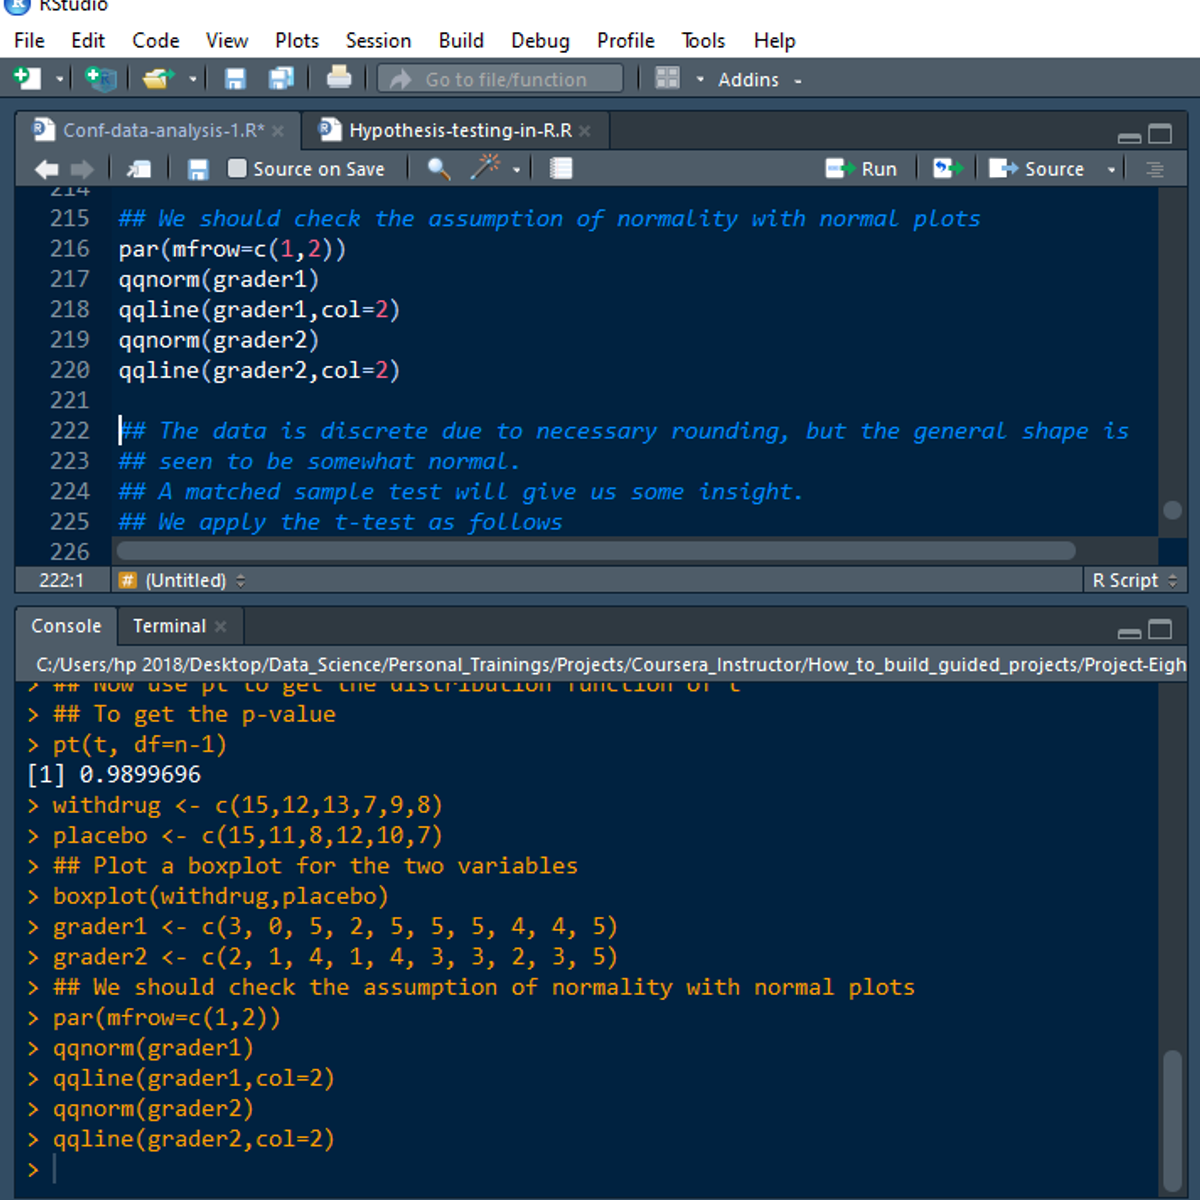


Data Science Courses - Page 18
Showing results 171-180 of 1407
Hypothesis Testing in R
Welcome to this project-based course Hypothesis Testing in R. In this project, you will learn how to perform extensive hypothesis tests for one and two samples in R.
By the end of this 2-hour long project, you will understand the rationale behind performing hypothesis testing. Also, you will learn how to perform hypothesis tests for proportions and means. By extension, you will learn how to perform a hypothesis test for means of matched or paired samples in R.
Note, you do not need to be a statistical analyst or data scientist to be successful in this guided project, just a familiarity with basic statistics and using R suffice for this project. If you are not familiar with R and want to learn the basics, start with my previous guided project titled “Getting Started with R”, and "Calculating Descriptive Statistics in R".
A fundamental prerequisite is having a good understanding of the theory of hypothesis test.
Tidy Messy Data using tidyr in R
As data enthusiasts and professionals, our work often requires dealing with data in different forms. In particular, messy data can be a big challenge because the quality of your analysis largely depends on the quality of the data. This project-based course, "Tidy Messy Data using tidyr in R," is intended for beginner and intermediate R users with related experiences who are willing to advance their knowledge and skills.
In this course, you will learn practical ways for data cleaning, reshaping, and transformation using R. You will learn how to use different tidyr functions like pivot_longer(), pivot_wider(), separate_rows(), separate(), and others to achieve the tidy data principles. By the end of this 2-hour-long project, you will get hands-on massaging data to put in the proper format. By extension, you will learn to create plots using ggplot().
This project-based course is a beginner to an intermediate-level course in R. Therefore, to get the most out of this project, it is essential to have a basic understanding of using R. Specifically, you should be able to load data into R and understand how the pipe function works. It will be helpful to complete my previous project titled "Data Manipulation with dplyr in R."
Calculus through Data & Modeling: Applying Differentiation
As rates of change, derivatives give us information about the shape of a graph. In this course, we will apply the derivative to find linear approximations for single-variable and multi-variable functions. This gives us a straightforward way to estimate functions that may be complicated or difficult to evaluate. We will also use the derivative to locate the maximum and minimum values of a function. These optimization techniques are important for all fields, including the natural sciences and data analysis. The topics in this course lend themselves to many real-world applications, such as machine learning, minimizing costs or maximizing profits.
Improving Deep Neural Networks: Hyperparameter Tuning, Regularization and Optimization
In the second course of the Deep Learning Specialization, you will open the deep learning black box to understand the processes that drive performance and generate good results systematically.
By the end, you will learn the best practices to train and develop test sets and analyze bias/variance for building deep learning applications; be able to use standard neural network techniques such as initialization, L2 and dropout regularization, hyperparameter tuning, batch normalization, and gradient checking; implement and apply a variety of optimization algorithms, such as mini-batch gradient descent, Momentum, RMSprop and Adam, and check for their convergence; and implement a neural network in TensorFlow.
The Deep Learning Specialization is our foundational program that will help you understand the capabilities, challenges, and consequences of deep learning and prepare you to participate in the development of leading-edge AI technology. It provides a pathway for you to gain the knowledge and skills to apply machine learning to your work, level up your technical career, and take the definitive step in the world of AI.
Databases and SQL for Data Science with Python
Working knowledge of SQL (or Structured Query Language) is a must for data professionals like Data Scientists, Data Analysts and Data Engineers. Much of the world's data resides in databases. SQL is a powerful language used for communicating with and extracting data from databases.
In this course you will learn SQL inside out- from the very basics of Select statements to advanced concepts like JOINs.
You will:
-write foundational SQL statements like: SELECT, INSERT, UPDATE, and DELETE
-filter result sets, use WHERE, COUNT, DISTINCT, and LIMIT clauses
-differentiate between DML & DDL
-CREATE, ALTER, DROP and load tables
-use string patterns and ranges; ORDER and GROUP result sets, and built-in database functions
-build sub-queries and query data from multiple tables
-access databases as a data scientist using Jupyter notebooks with SQL and Python
-work with advanced concepts like Stored Procedures, Views, ACID Transactions, Inner & Outer JOINs
Through hands-on labs and projects, you will practice building SQL queries, work with real databases on the Cloud, and use real data science tools. In the final project you’ll analyze multiple real-world datasets to demonstrate your skills.
Introduction to Bayesian Statistics
The objective of this course is to introduce Computational Statistics to aspiring or new data scientists. The attendees will start off by learning the basics of probability, Bayesian modeling and inference. This will be the first course in a specialization of three courses .Python and Jupyter notebooks will be used throughout this course to illustrate and perform Bayesian modeling. The course website is located at https://sjster.github.io/introduction_to_computational_statistics/docs/index.html. The course notebooks can be downloaded from this website by following the instructions on page https://sjster.github.io/introduction_to_computational_statistics/docs/getting_started.html.
The instructors for this course will be Dr. Srijith Rajamohan and Dr. Robert Settlage.
Data Analyst Career Guide and Interview Preparation
This course is designed to prepare you to enter the job market as a data analyst. It provides guidance about the regular functions and tasks of data analysts and their place in the data ecosystem, as well as the opportunities of the profession and some options for career development. It explains practical techniques for creating essential job-seeking materials such as a resume and a portfolio, as well as auxiliary tools like a cover letter and an elevator pitch. You will learn how to find and assess prospective job positions, apply to them, and lay the groundwork for interviewing. You will also get inside tips and steps you can use to perform professionally and effectively at interviews. Let seasoned professionals share their experience to help you get ahead of the competition.
Data Analysis with Python
Analyzing data with Python is an essential skill for Data Scientists and Data Analysts. This course will take you from the basics of data analysis with Python to building and evaluating data models.
Topics covered include:
- collecting and importing data
- cleaning, preparing & formatting data
- data frame manipulation
- summarizing data,
- building machine learning regression models
- model refinement
- creating data pipelines
You will learn how to import data from multiple sources, clean and wrangle data, perform exploratory data analysis (EDA), and create meaningful data visualizations. You will then predict future trends from data by developing linear, multiple, polynomial regression models & pipelines and learn how to evaluate them.
In addition to video lectures you will learn and practice using hands-on labs and projects. You will work with several open source Python libraries, including Pandas and Numpy to load, manipulate, analyze, and visualize cool datasets. You will also work with scipy and scikit-learn, to build machine learning models and make predictions.
If you choose to take this course and earn the Coursera course certificate, you will also earn an IBM digital badge.
Excel Time Series Models for Business Forecasting
This course explores different time series business forecasting methods. The course covers a variety of business forecasting methods for different types of components present in time series data — level, trending, and seasonal. We will learn about the theoretical methods and apply these methods to business data using Microsoft Excel. These forecasting methods will be programmed into Microsoft Excel, displayed graphically, and we will optimise these models to produce accurate forecasts. We will compare different models and their forecasts to decide which model best suits our business' needs.
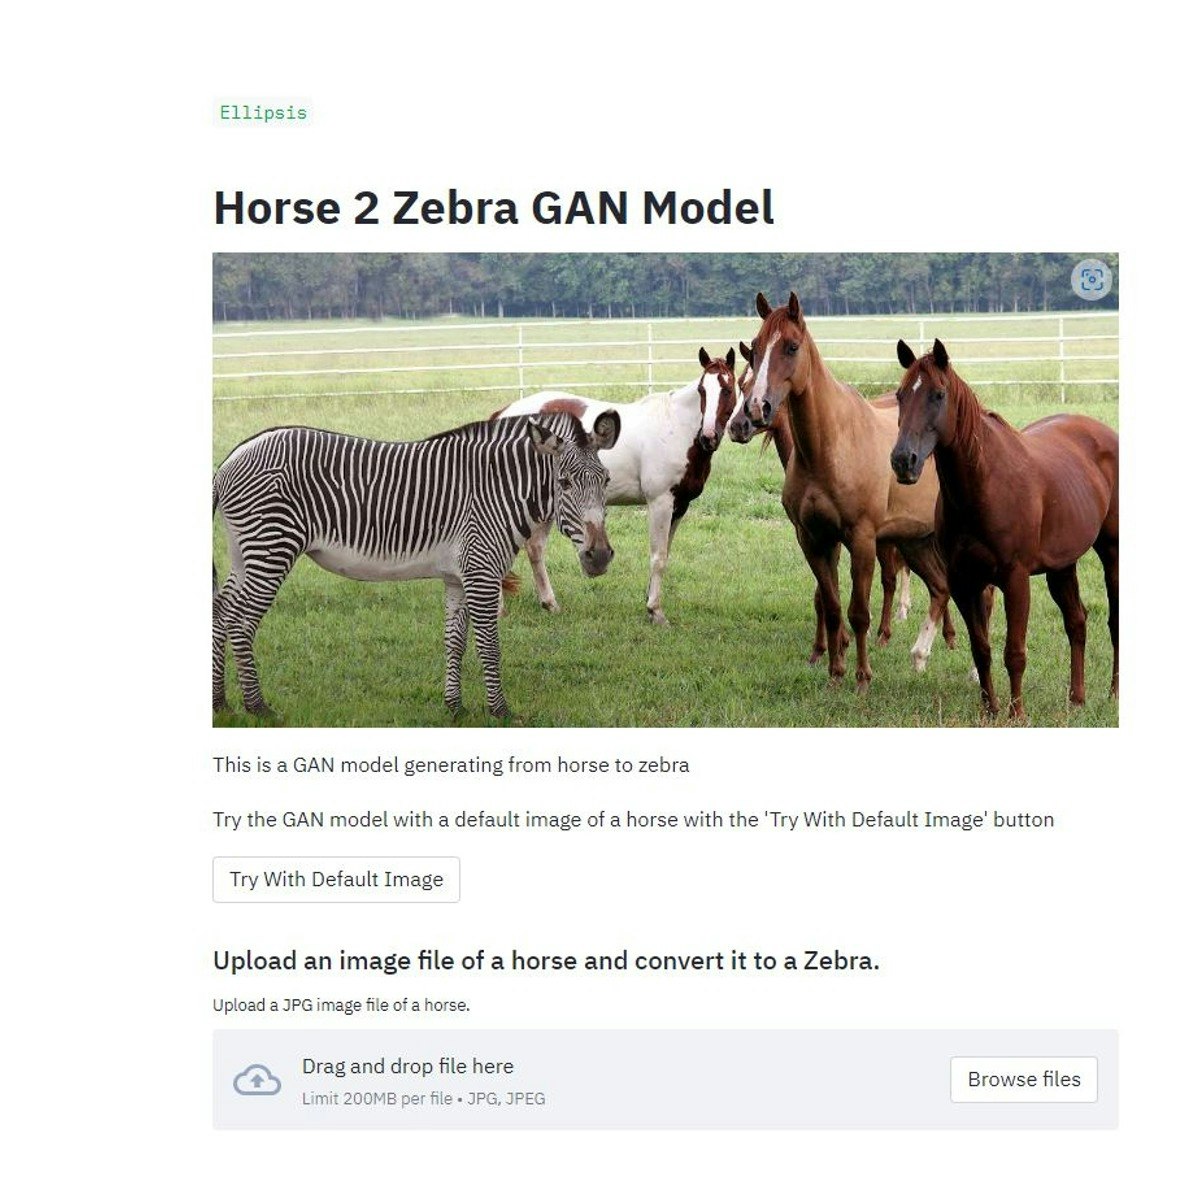
Building a Keras Horse Zebra CycleGAN Webapp with Streamlit
Welcome to the “Building a Keras Horse Zebra CycleGAN Webapp with Streamlit” guided project.
In this project, we will build a Streamlit web app of a keras trained computer vision CycleGAN for horse images to zebra and vice versa. This project will take a jpg image of a horse and transform it into a zebra and take a picture of a zebra and transform it to a horse.
This project is an intermediate python project for anyone interested in learning about how to productionize computer vision models or more specifically a beginner GAN model with Streamlit and Python.
It requires preliminary knowledge on how to build and train GAN models (as we will not be building or training models) but we will be using a model that has already been trained and provided in the workspace.
Popular Internships and Jobs by Categories
Find Jobs & Internships
Browse


© 2024 BoostGrad | All rights reserved