Back to Courses
Crime Zone Heatmaps with Python and Folium
Overview
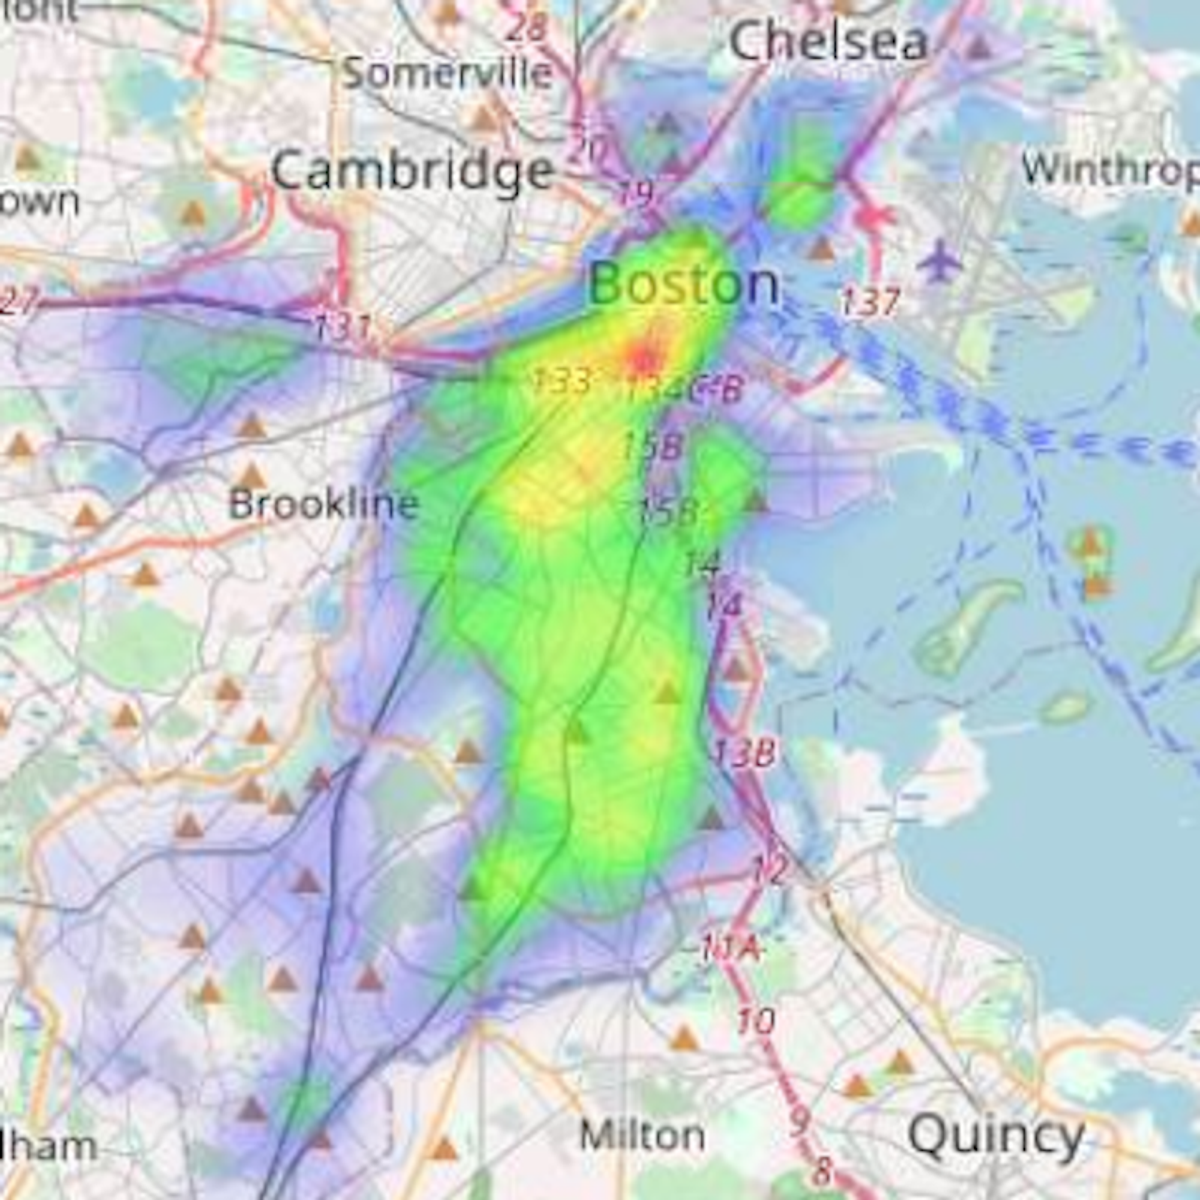
In this one hour long project-based course, you will tackle a real-world problem in data analysis and visualization. You will process a dataset of crime incidents in the city of Boston, and use this data to create an animated heatmap displaying crime hotspots. Heatmaps use color to display a quantity that changes over two dimensions. By the end of this project, you will have created heatmaps using code you will write in Python.
Your dream job is just a tap away — only on the BoostGrad app.

View on Boostgrad App
View on Browser
Continue
Download the app