Back to Courses








Data Analysis Courses - Page 90
Showing results 891-900 of 998

Storytelling With Data
We all love stories, so why don't we use more of them at work? In this project we will help you learn some tools of good storytelling and create one for a freely available data set from KIVA, the microloan organization.

Simulation Models for Decision Making
This course is primarily aimed at third- and fourth-year undergraduate students or graduate students interested in learning simulation techniques to solve business problems.
The course will introduce you to take everyday and complex business problems that have no one correct answer due to uncertainties that exist in business environments. Simulation modeling allows us to explore various outcomes and protect personal or business interests against unwanted outcomes. We can model uncertainties by using the concepts of probability and stepwise thinking. Stepwise thinking allows us to break down the problem in smaller components, explore dependencies between related events and allows us to focus on aspects of problem that are prone to changes due to future uncertainties.
The course will introduce you to advanced Excel techniques to model and execute simulation models. Many of the Excel techniques learned in the course will be useful beyond simulation modeling. We will learn both Monte Carlo simulation techniques where overall outcome is of primary interest and discrete event simulation where intermediate dependencies between related events might be of interest. The course will introduce you to several practical issues in simulation modeling that are normally not covered in textbooks. The course uses a few running examples throughout the course to demonstrate concepts and provide concrete modeling examples.
After taking the course a student will be able to develop fairly advanced simulation models to explore fairly broad range of business environments and outcomes.

Information Visualization: Applied Perception
This module aims at introducing fundamental concepts of visual perception applied to information visualization. These concepts help the student ideate and evaluate visualization designs in terms of how well they leverage the capabilities of the human perceptual machinery.

A Crash Course in Data Science
By now you have definitely heard about data science and big data. In this one-week class, we will provide a crash course in what these terms mean and how they play a role in successful organizations. This class is for anyone who wants to learn what all the data science action is about, including those who will eventually need to manage data scientists. The goal is to get you up to speed as quickly as possible on data science without all the fluff. We've designed this course to be as convenient as possible without sacrificing any of the essentials.
This is a focused course designed to rapidly get you up to speed on the field of data science. Our goal was to make this as convenient as possible for you without sacrificing any essential content. We've left the technical information aside so that you can focus on managing your team and moving it forward.
After completing this course you will know.
1. How to describe the role data science plays in various contexts
2. How statistics, machine learning, and software engineering play a role in data science
3. How to describe the structure of a data science project
4. Know the key terms and tools used by data scientists
5. How to identify a successful and an unsuccessful data science project
3. The role of a data science manager
Course cover image by r2hox. Creative Commons BY-SA: https://flic.kr/p/gdMuhT
Preparing for the SAS Programming Certification Exam
In this course you have the opportunity to use the skills you acquired in the two SAS programming courses to solve realistic problems. This course is also designed to give you a thorough review of SAS programming concepts so you are prepared to take the SAS Certified Specialist: Base Programming Using SAS 9.4 Exam.

Query Client Data with LibreOffice Base
By the end of this project you will have used the Query Design window in LibreOffice Base to construct and run queries that retrieve, sort, filter, and perform calculations on data from a multi-table relational Client database. Results returned from a query can be used to analyze client data to support business decisions.
Note: This course works best for learners who are based in the North America region. We’re currently working on providing the same experience in other regions.

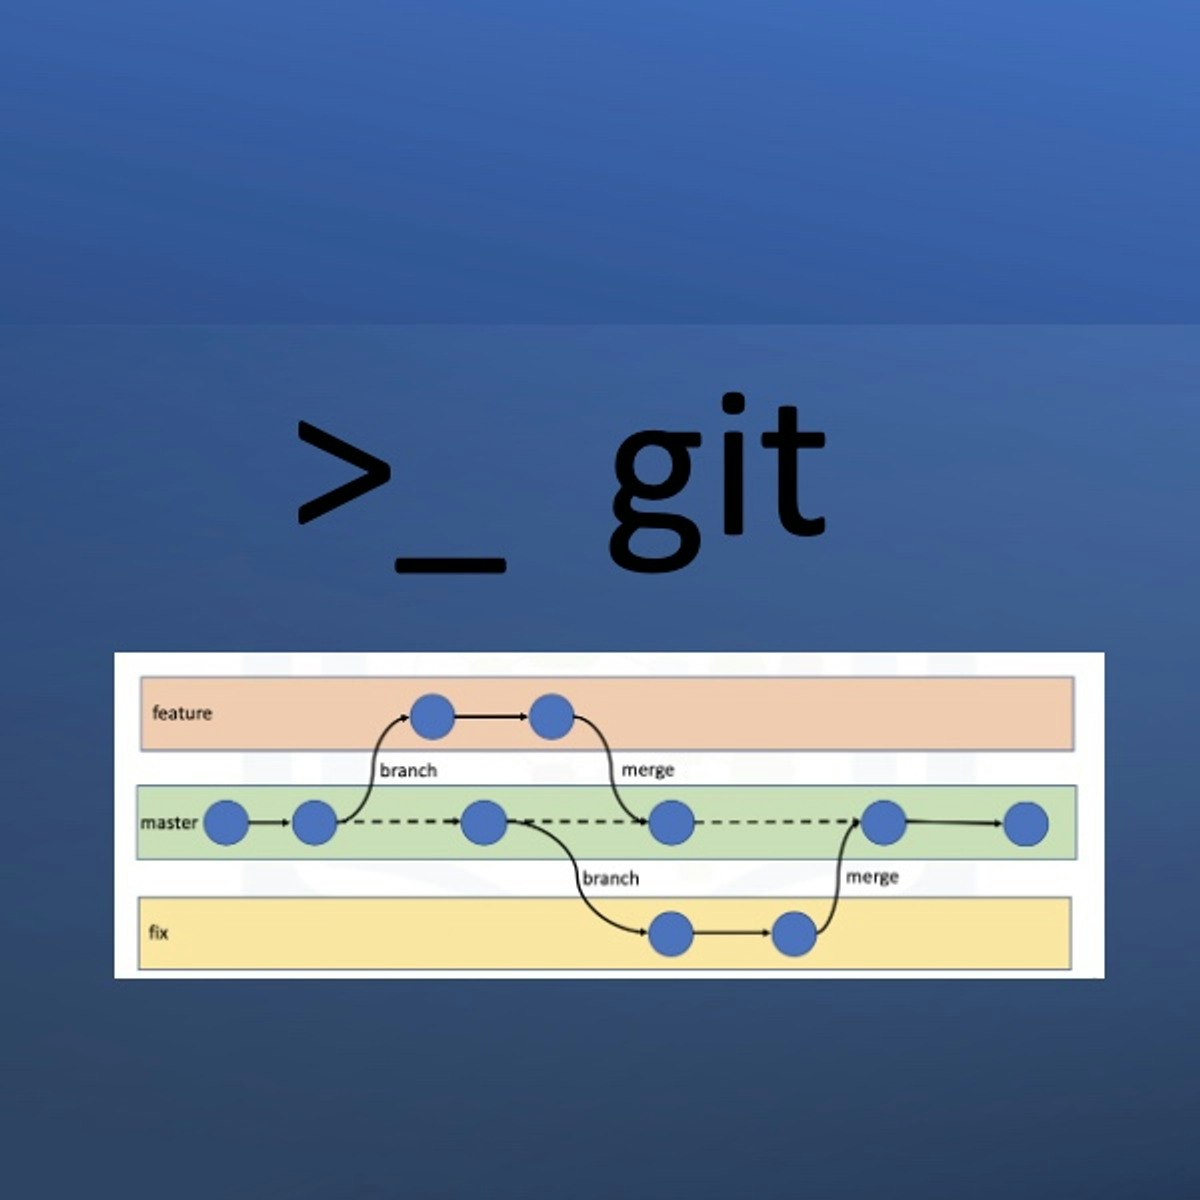
Getting Started with Git and GitHub
Collaboration and social coding are crucial parts of contemporary Software Engineering practices and the DevOps culture. In this course, you’ll be introduced to collaborative version control and popular Git platforms.
You will explore key Git concepts such as branching and repositories, as well as the use of Git commands. You will also learn and practice various Git concepts such as forking, cloning and merging workflows. You will learn to use GitHub to work effectively as a team, and perform common Git operations, such as Pull Requests, from both the Web UI and command line.
Developed and taught by experienced IBM practitioners, in this course you’ll gain vital skills and hands-on experience using Git and GitHub. Each module contains hands-on labs for you to apply and practice what you learn. The course wraps up with a final project where you will start building your portfolio by creating and sharing a public/open-source GitHub project.
All hands-on activities in this course can be performed using web-browser based tools and interfaces. Installation of any specialized software is NOT required on your own computer in order to complete the course.

Analyzing and Visualizing Data in Looker
In this course, you learn how to do the kind of data exploration and analysis in Looker that would formerly be done primarily by SQL developers or analysts. Upon completion of this course, you will be able to leverage Looker's modern analytics platform to find and explore relevant content in your organization’s Looker instance, ask questions of your data, create new metrics as needed, and build and share visualizations and dashboards to facilitate data-driven decision making.

IBM Data Topology
Every business and organization is facing new challenges with their data. Pressures related to regulation and compliance, leveraging AI, spanning multicloud environments, and increasing volumes of inaccessible data are forcing executives and administrators to either modernize their infrastructures or become obsolete. But moving to the latest technology in a monolithic architecture is a tempting solution that can be expensive and cause more problems than it solves. In this course, you learn how to meet the needs of all your data consumers through the construction of a modern logical topology that helps you optimize data flow.

Data Analysis Using Python
This course provides an introduction to basic data science techniques using Python. Students are introduced to core concepts like Data Frames and joining data, and learn how to use data analysis libraries like pandas, numpy, and matplotlib. This course provides an overview of loading, inspecting, and querying real-world data, and how to answer basic questions about that data. Students will gain skills in data aggregation and summarization, as well as basic data visualization.
Popular Internships and Jobs by Categories
Browse
© 2024 BoostGrad | All rights reserved


