Back to Courses





Data Analysis Courses - Page 89
Showing results 881-890 of 998

A Scientific Approach to Innovation Management
How can innovators understand if their idea is worth developing and pursuing? In this course, we lay out a systematic process to make strategic decisions about innovative product or services that will help entrepreneurs, managers and innovators to avoid common pitfalls. We teach students to assess the feasibility of an innovative idea through problem-framing techniques and rigorous data analysis labelled ‘a scientific approach’. The course is highly interactive and includes exercises and real-world applications. We will also show the implications of a scientific approach to innovation management through a wide range of examples and case studies.

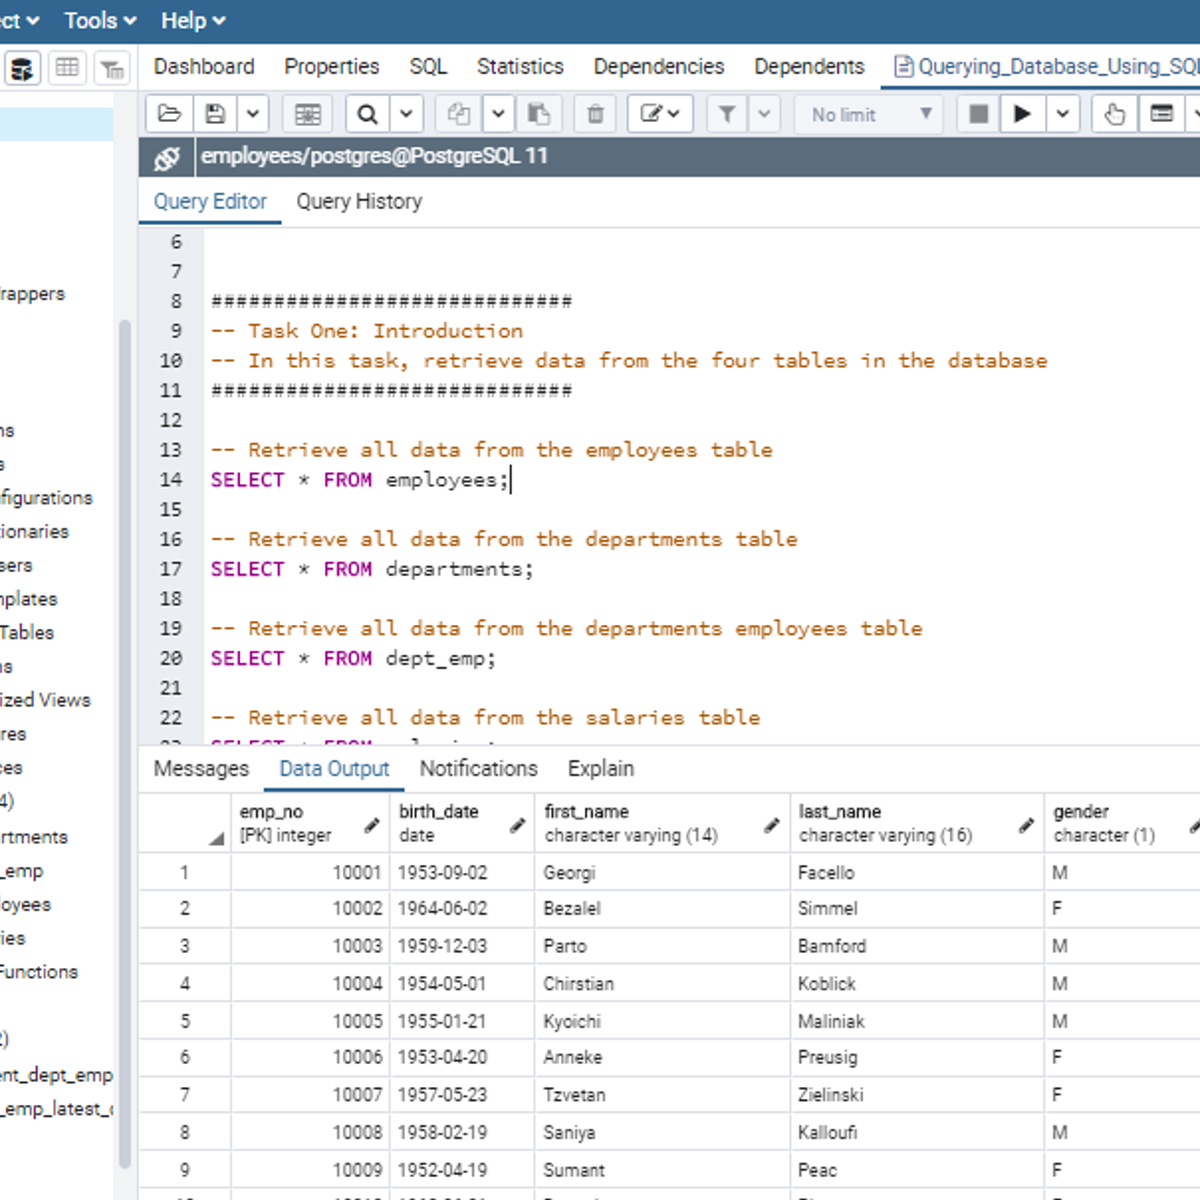
Querying Databases Using SQL SELECT statement
In this 2-hour long project-based course, you will learn how to retrieve data from tables in a database using SQL SELECT statement. In addition, this project will expose you to how to use different SQL operators together with the WHERE clause to set conditions on tables in a database for database manipulation. In order to reinforce the use of SQL SELECT statement to query a database for database insights, you will work on different tasks as the concepts are being introduced to you.
Note: You do not need to be a data administrator or data analyst to be successful in this guided project, just a familiarity with SQL is required. If you are not familiar with SQL and want to learn the basics, start with my previous guided project titled “Performing Data Definition and Manipulation in SQL”.

Getting Started with CyberGIS
This course is intended to introduce students to CyberGIS—Geospatial Information Science and Systems (GIS)—based on advanced cyberinfrastructure as well as the state of the art in high-performance computing, big data, and cloud computing in the context of geospatial data science. Emphasis is placed on learning the cutting-edge advances of cyberGIS and its underlying geospatial data science principles.

Wearable Technologies and Sports Analytics
Sports analytics now include massive datasets from athletes and teams that quantify both training and competition efforts. Wearable technology devices are being worn by athletes everyday and provide considerable opportunities for an in-depth look at the stress and recovery of athletes across entire seasons. The capturing of these large datasets has led to new hypotheses and strategies regarding injury prevention as well as detailed feedback for athletes to try and optimize training and recovery.
This course is an introduction to wearable technology devices and their use in training and competition as part of the larger field of sport sciences. It includes an introduction to the physiological principles that are relevant to exercise training and sport performance and how wearable devices can be used to help characterize both training and performance. It includes access to some large sport team datasets and uses programming in python to explore concepts related to training, recovery and performance.

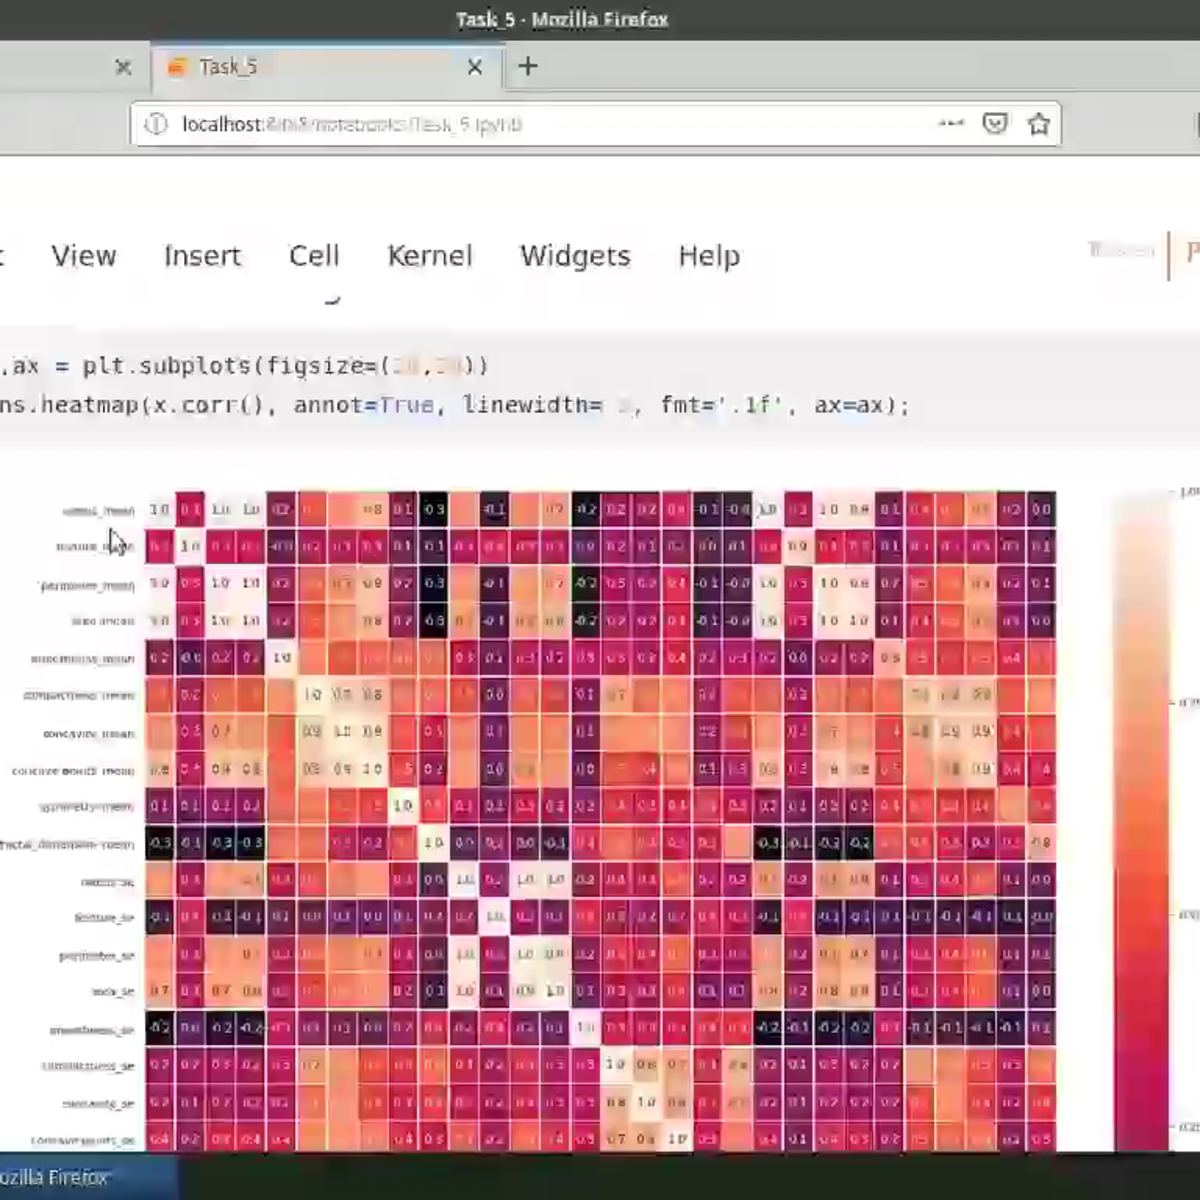
Exploratory Data Analysis with Seaborn
Producing visualizations is an important first step in exploring and analyzing real-world data sets. As such, visualization is an indispensable method in any data scientist's toolbox. It is also a powerful tool to identify problems in analyses and for illustrating results.In this project-based course, we will employ the statistical data visualization library, Seaborn, to discover and explore the relationships in the Breast Cancer Wisconsin (Diagnostic) Data Set. We will cover key concepts in exploratory data analysis (EDA) using visualizations to identify and interpret inherent relationships in the data set, produce various chart types including histograms, violin plots, box plots, joint plots, pair grids, and heatmaps, customize plot aesthetics and apply faceting methods to visualize higher dimensional data.
This course runs on Coursera's hands-on project platform called Rhyme. On Rhyme, you do projects in a hands-on manner in your browser. You will get instant access to pre-configured cloud desktops containing all of the software and data you need for the project. Everything is already set up directly in your internet browser so you can just focus on learning. For this project, you’ll get instant access to a cloud desktop with Python, Jupyter, and scikit-learn pre-installed.
Notes:
- You will be able to access the cloud desktop 5 times. However, you will be able to access instructions videos as many times as you want.
- This course works best for learners who are based in the North America region. We’re currently working on providing the same experience in other regions.

Data Literacy Capstone – Evaluating Research
This is the final course in the Data Literacy Specialization. In this capstone course, you'll apply the skills and knowledge you have acquired in the specialization to the critical evaluation of an original quantitative analysis. The project will first require you to identify and read a piece of high-quality, original, quantitative research on a topic of your choosing. You’ll then interpret and evaluate the findings as well as the methodological approach. As part of the project, you’ll also review other students’ submissions. By the end of the project, you should be empowered to be a critical consumer and user of quantitative research.

Python Data Analysis
This course will continue the introduction to Python programming that started with Python Programming Essentials and Python Data Representations. We'll learn about reading, storing, and processing tabular data, which are common tasks. We will also teach you about CSV files and Python's support for reading and writing them. CSV files are a generic, plain text file format that allows you to exchange tabular data between different programs. These concepts and skills will help you to further extend your Python programming knowledge and allow you to process more complex data.
By the end of the course, you will be comfortable working with tabular data in Python. This will extend your Python programming expertise, enabling you to write a wider range of scripts using Python.
This course uses Python 3. While most Python programs continue to use Python 2, Python 3 is the future of the Python programming language. This course uses basic desktop Python development environments, allowing you to run Python programs directly on your computer.
Finalize a Data Science Project
This course is designed for business professionals that want to learn how to gather results from previous stages of the data science project and present them to stakeholders. Learners will communicate the results of a model to stakeholders, be shown how to build a basic web app to demonstrate machine learning models and implement and test pipelines that automate the model training, tuning and deployment processes.
The typical student in this course will have completed previous courses in the CDSP professional certificate program, and have several years of experience with computing technology, including some aptitude in computer programming.

Big Data Integration and Processing
At the end of the course, you will be able to:
*Retrieve data from example database and big data management systems
*Describe the connections between data management operations and the big data processing patterns needed to utilize them in large-scale analytical applications
*Identify when a big data problem needs data integration
*Execute simple big data integration and processing on Hadoop and Spark platforms
This course is for those new to data science. Completion of Intro to Big Data is recommended. No prior programming experience is needed, although the ability to install applications and utilize a virtual machine is necessary to complete the hands-on assignments. Refer to the specialization technical requirements for complete hardware and software specifications.
Hardware Requirements:
(A) Quad Core Processor (VT-x or AMD-V support recommended), 64-bit; (B) 8 GB RAM; (C) 20 GB disk free. How to find your hardware information: (Windows): Open System by clicking the Start button, right-clicking Computer, and then clicking Properties; (Mac): Open Overview by clicking on the Apple menu and clicking “About This Mac.” Most computers with 8 GB RAM purchased in the last 3 years will meet the minimum requirements.You will need a high speed internet connection because you will be downloading files up to 4 Gb in size.
Software Requirements:
This course relies on several open-source software tools, including Apache Hadoop. All required software can be downloaded and installed free of charge (except for data charges from your internet provider). Software requirements include: Windows 7+, Mac OS X 10.10+, Ubuntu 14.04+ or CentOS 6+ VirtualBox 5+.

Introduction to PyMC3 for Bayesian Modeling and Inference
The objective of this course is to introduce PyMC3 for Bayesian Modeling and Inference, The attendees will start off by learning the the basics of PyMC3 and learn how to perform scalable inference for a variety of problems. This will be the final course in a specialization of three courses .Python and Jupyter notebooks will be used throughout this course to illustrate and perform Bayesian modeling with PyMC3.. The course website is located at https://sjster.github.io/introduction_to_computational_statistics/docs/index.html. The course notebooks can be downloaded from this website by following the instructions on page https://sjster.github.io/introduction_to_computational_statistics/docs/getting_started.html.
The instructor for this course will be Dr. Srijith Rajamohan.
Popular Internships and Jobs by Categories
Browse
© 2024 BoostGrad | All rights reserved


