Back to Courses


Data Analysis Courses - Page 53
Showing results 521-530 of 998
Conditional Formatting, Tables and Charts in Microsoft Excel
In this project, you will learn how to analyze data and identify trends using a variety of tools in Microsoft Excel. Conditional formatting and charts are two tools that focus on highlighting and representing data in a visual form. With conditional formatting, you can define rules to highlight cells using a range of color scales and icons and to help you analyze data and identify trends or outliers. You will then use PivotTables to create summaries of the data that focuses on specific relationships which you will represent as a line chart and column chart. Both conditional formatting and charts are two useful ways of visually analyzing data and exploring trends.
Ethical Issues in Data Science
Computing applications involving large amounts of data – the domain of data science – impact the lives of most people in the U.S. and the world. These impacts include recommendations made to us by internet-based systems, information that is available about us online, techniques that are used for security and surveillance, data that is used in health care, and many more. In many cases, they are affected by techniques in artificial intelligence and machine learning.
This course examines some of the ethical issues related to data science, with the fundamental objective of making data science professionals aware of and sensitive to ethical considerations that may arise in their careers. It does this through a combination of discussion of ethical frameworks, examination of a variety of data science applications that lead to ethical considerations, reading current media and scholarly articles, and drawing upon the perspectives and experiences of fellow students and computing professionals.
Ethical Issues in Data Science can be taken for academic credit as part of CU Boulder’s Master of Science in Data Science (MS-DS) degree offered on the Coursera platform. The MS-DS is an interdisciplinary degree that brings together faculty from CU Boulder’s departments of Applied Mathematics, Computer Science, Information Science, and others. With performance-based admissions and no application process, the MS-DS is ideal for individuals with a broad range of undergraduate education and/or professional experience in computer science, information science, mathematics, and statistics. Learn more about the MS-DS program at https://www.coursera.org/degrees/master-of-science-data-science-boulder.
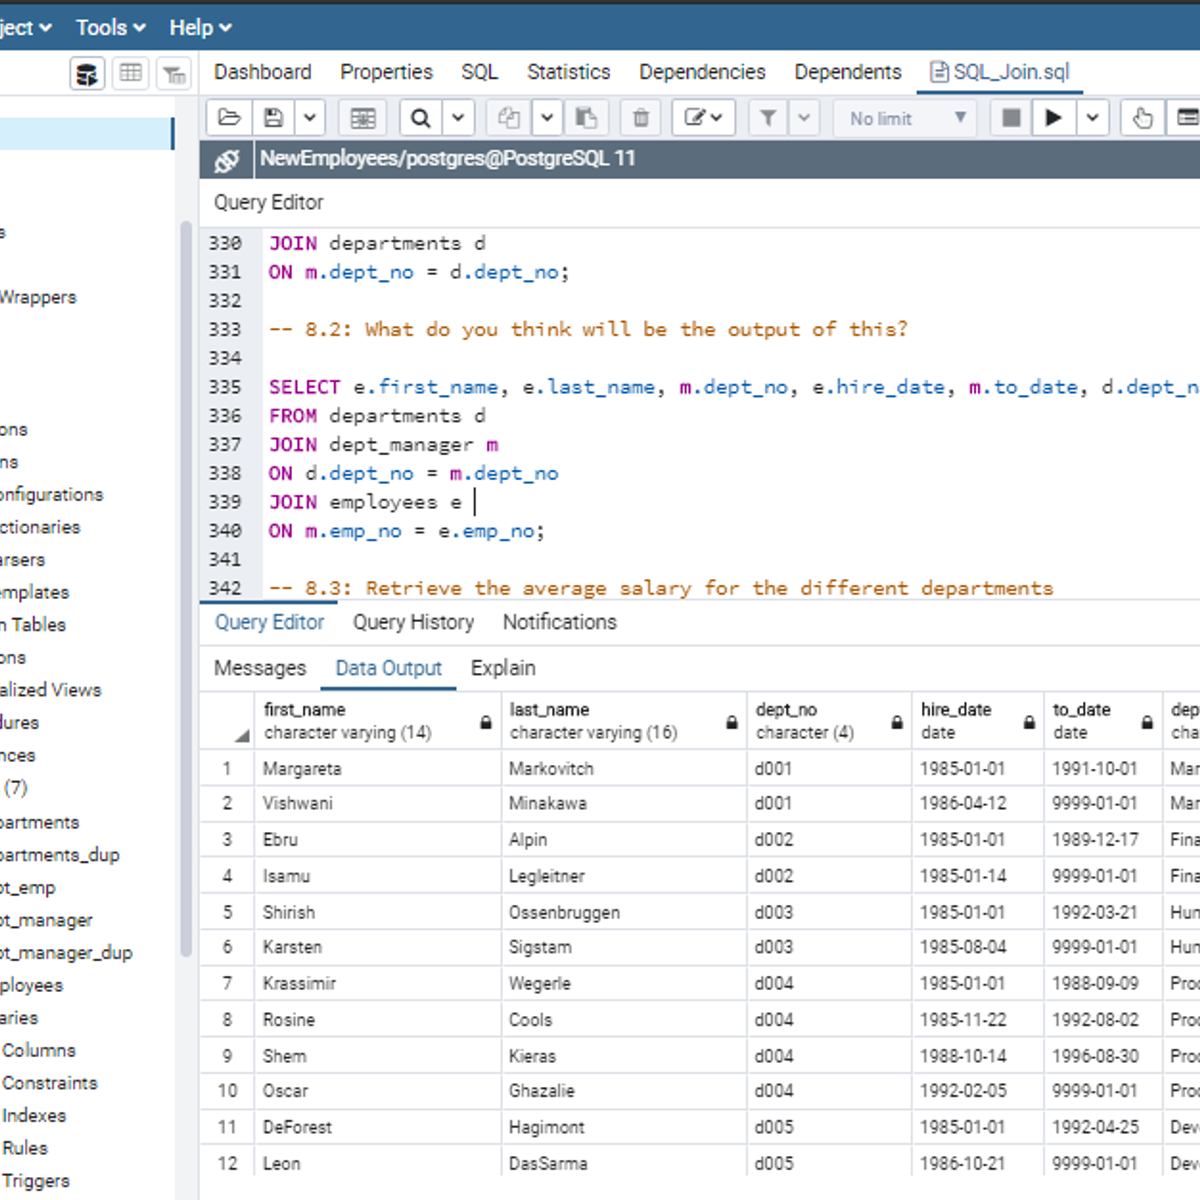
Mastering SQL Joins
In this 2-hour long project-based course, you will understand how to use SQL joins like INNER JOIN, LEFT JOIN, and RIGHT JOIN to get a desired result set. In addition, you will learn how to use SQL Joins with the WHERE clause and with aggregate functions. By extension, you will learn how to join more than two tables in the database.
Note: You do not need to be a data administrator or data analyst expert to be successful in this guided project, just you have to be familiar with querying databases using SQL SELECT statement to get the most of this project. If you are not familiar with SQL and want to learn the basics, start with my previous guided projects titled “Performing Data definition and Manipulation in SQL", “Querying Databases using SQL SELECT statement” and “Performing Data Aggregation using SQL Aggregate Functions”
Connect an App to a Cloud SQL for PostgreSQL Instance
This is a self-paced lab that takes place in the Google Cloud console. In this lab you will create a Kubernetes cluster and deploy a simple application to that cluster. Then, connect the application to the supplied Cloud SQL for PostgreSQL database instance and confirm that it is able to write to and read from it.
Relational database systems
Welcome to the specialization course Relational Database Systems. This course will be completed on six weeks, it will be supported with videos and various documents that will allow you to learn in a very simple way how several types of information systems and databases are available to solve different problems and needs of the companies.
Objective:
A learner will be able to design, test, and implement analytical, transactional or NoSQL database systems according to business requirements by programming reliable, scalable and maintainable applications and resources using SQL and Hadoop ecosystem.
Programming languages:
For course 1 you will use the MYSQL language.
Software to download:
MySQL
Workbench
In case you have a Mac / IOS operating system you will need to use a virtual Machine (VirtualBox, Vmware).
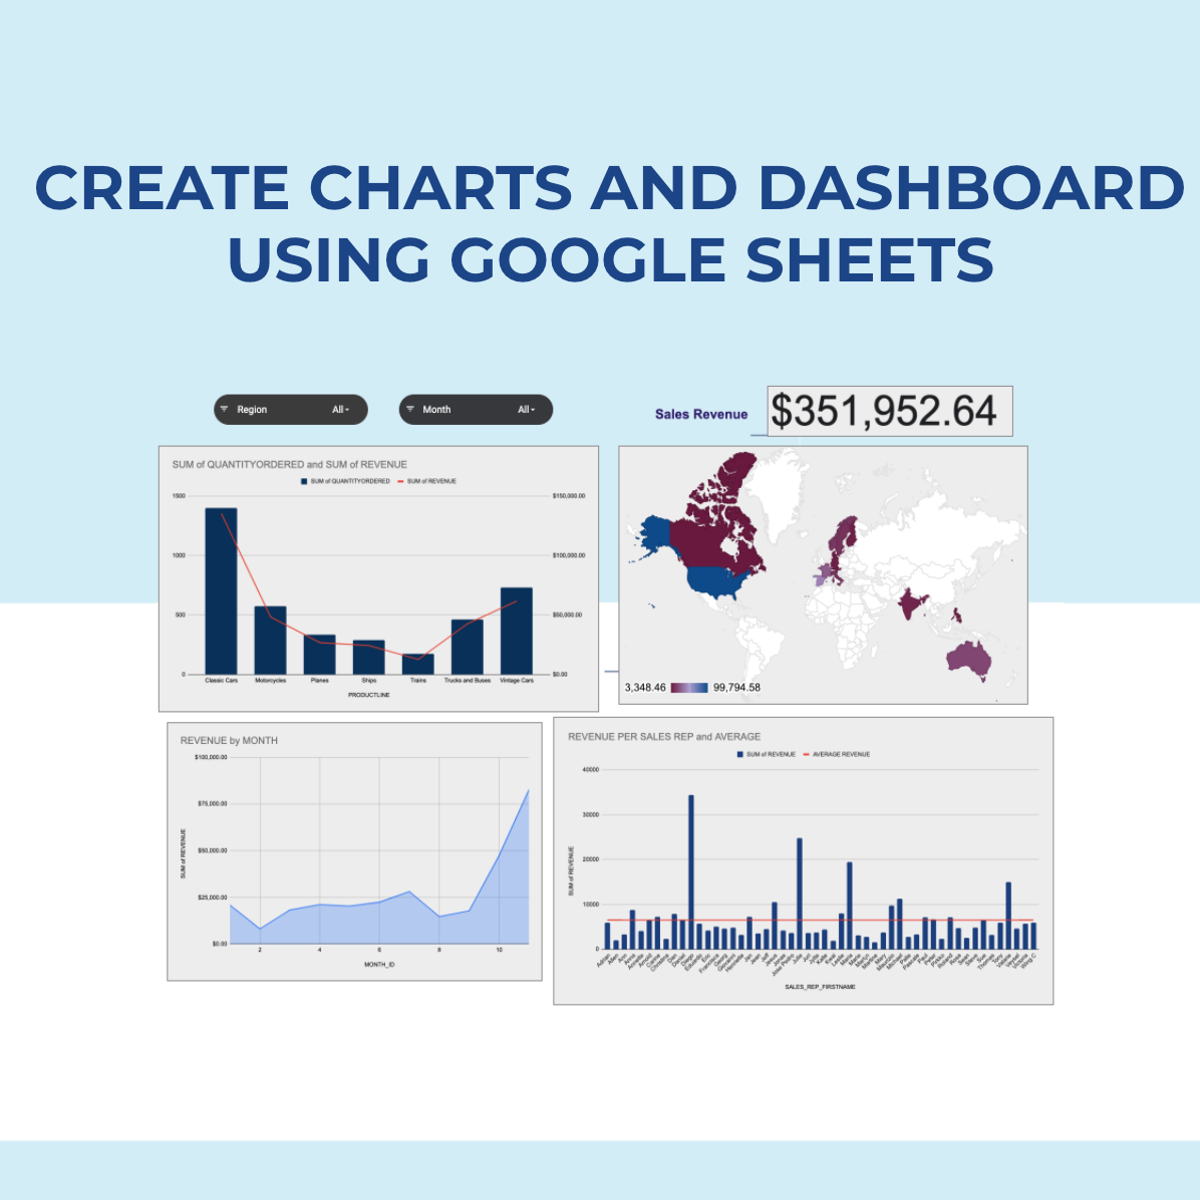
Create Charts and Dashboard using Google Sheets
In this 2-hour long project-based course, you will learn how to create effective charts and a dynamic dashboard to visualize data sets. You will be able to work with vlookups, pivot tables and basic formulas and be able to create dynamic charts, sparklines, and a robust, dynamic dashboard to present the data.
By the end of the project you will be able to:
- Understand the terminologies of spreadsheets
- Work with basic formulas in Google Sheets
- Create 8 Basic Charts for visualizing data
- Generate Dynamic Charts from a dropdown list
- Generate Sparklines to represent data
- Build a dashboard and introduce Basic and Advanced Charts
- Use Slicers to filter data and create a robust and dynamic dashboard
Note: If you don't have a Google account, you will need to create one to be able to complete the content.
Capstone: Create Value from Open Data
The Capstone project is an individual assignment.
Participants decide the theme they want to explore and define the issue they want to solve. Their “playing field” should provide data from various sectors (such as farming and nutrition, culture, economy and employment, Education & Research, International & Europe, Housing, Sustainable, Development & Energies, Health & Social, Society, Territories & Transport). Participants are encouraged to mix the different fields and leverage the existing information with other (properly sourced) open data sets.
Deliverable 1 is the preliminary preparation and problem qualification step. The objectives is to define the what, why & how. What issue do we want to solve? Why does it promise value for public authorities, companies, citizens? How do we want to explore the provided data?
For Deliverable 2, the participant needs to present the intermediary outputs and adjustments to the analysis framework. The objectives is to confirm the how and the relevancy of the first results.
Finally, with Deliverable 3, the participant needs to present the final outputs and the value case. The objective is to confirm the why. Why will it create value for public authorities, companies, and citizens.
Assessment and grading: the participants will present their results to their peers on a regular basis. An evaluation framework will be provided for the participants to assess the quality of each other’s deliverables.
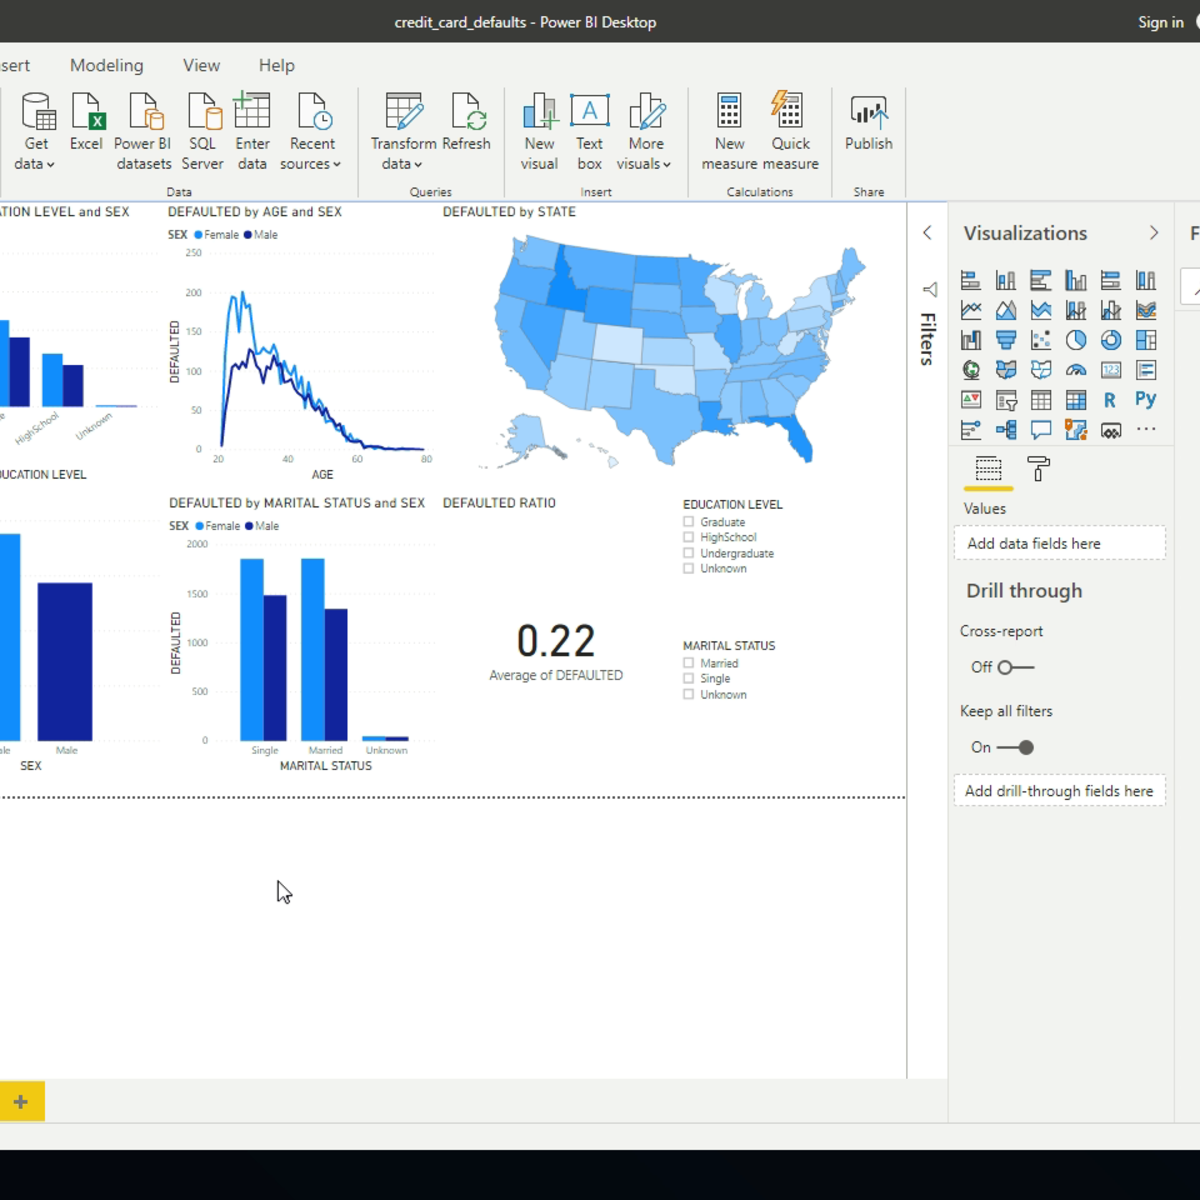
Getting Started with Power BI Desktop
In this 2-hour long project-based course, you will learn the basics of using Power BI Desktop software. We will do this by analyzing data on credit card defaults with Power BI Desktop. Power BI Desktop is a free Business Intelligence application from Microsoft that lets you load, transform, and visualize data. You can create interactive reports and dashboards quite easily, and quickly. We will learn some of the basics of Power BI by importing, transforming, and visualizing the data.
This course is aimed at learners who are looking to get started with the Power BI Desktop software. There are no hard prerequisites and any competent computer user should be able to complete the project successfully.
Note: This course works best for learners who are based in the North America region. We’re currently working on providing the same experience in other regions.
Statistical Analysis using Python Numpy
By the end of this project you will use the statistical capabilities of the Python Numpy package and other packages to find the statistical significance of student test data from two student groups.
The T-Test is well known in the field of statistics. It is used to test a hypothesis using a set of data sampled from the population. To perform the T-Test, the population sample size, the mean, or average, of each population, and the standard deviation are all required. These will all be calculated in this project.
Note: This course works best for learners who are based in the North America region. We’re currently working on providing the same experience in other regions.
Introduction to Neurohacking In R
Neurohacking describes how to use the R programming language (https://cran.r-project.org/) and its associated package to perform manipulation, processing, and analysis of neuroimaging data. We focus on publicly-available structural magnetic resonance imaging (MRI). We discuss concepts such as inhomogeneity correction, image registration, and image visualization.
By the end of this course, you will be able to:
Read/write images of the brain in the NIfTI (Neuroimaging Informatics Technology Initiative) format
Visualize and explore these images
Perform inhomogeneity correction, brain extraction, and image registration (within a subject and to a template).
Popular Internships and Jobs by Categories
Find Jobs & Internships
Browse


© 2024 BoostGrad | All rights reserved