Back to Courses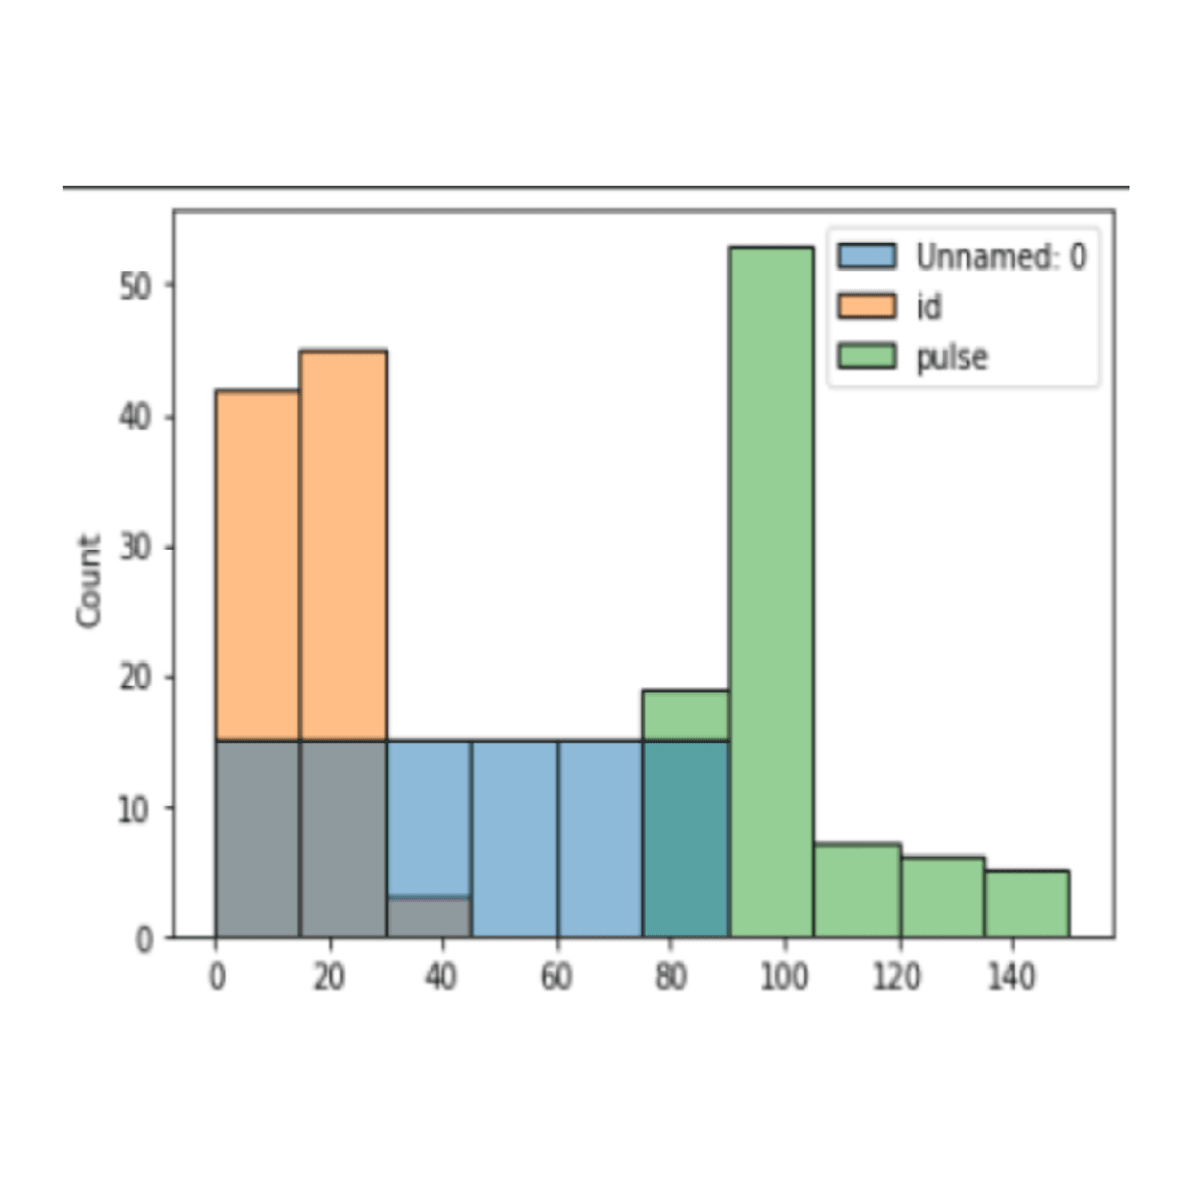


Data Analysis Courses - Page 54
Showing results 531-540 of 998
Conducting Exploratory Data Analysis
Conduct exploratory data analysis with a systematic approach to investigate different aspects of your data: comparisons, relationships, compositions, and distributions. This guided project gives you a framework so you can conduct your own exploratory data analysis and make your work more professional and organized. The language is Python and the libraries used are seaborn, pandas, and matplotlib.
Mastering Data Analysis with Pandas: Learning Path Part 2
In this structured series of hands-on guided projects, we will master the fundamentals of data analysis and manipulation with Pandas and Python. Pandas is a super powerful, fast, flexible and easy to use open-source data analysis and manipulation tool. This guided project is the second of a series of multiple guided projects (learning path) that is designed for anyone who wants to master data analysis with pandas.
Note: This course works best for learners who are based in the North America region. We’re currently working on providing the same experience in other regions.
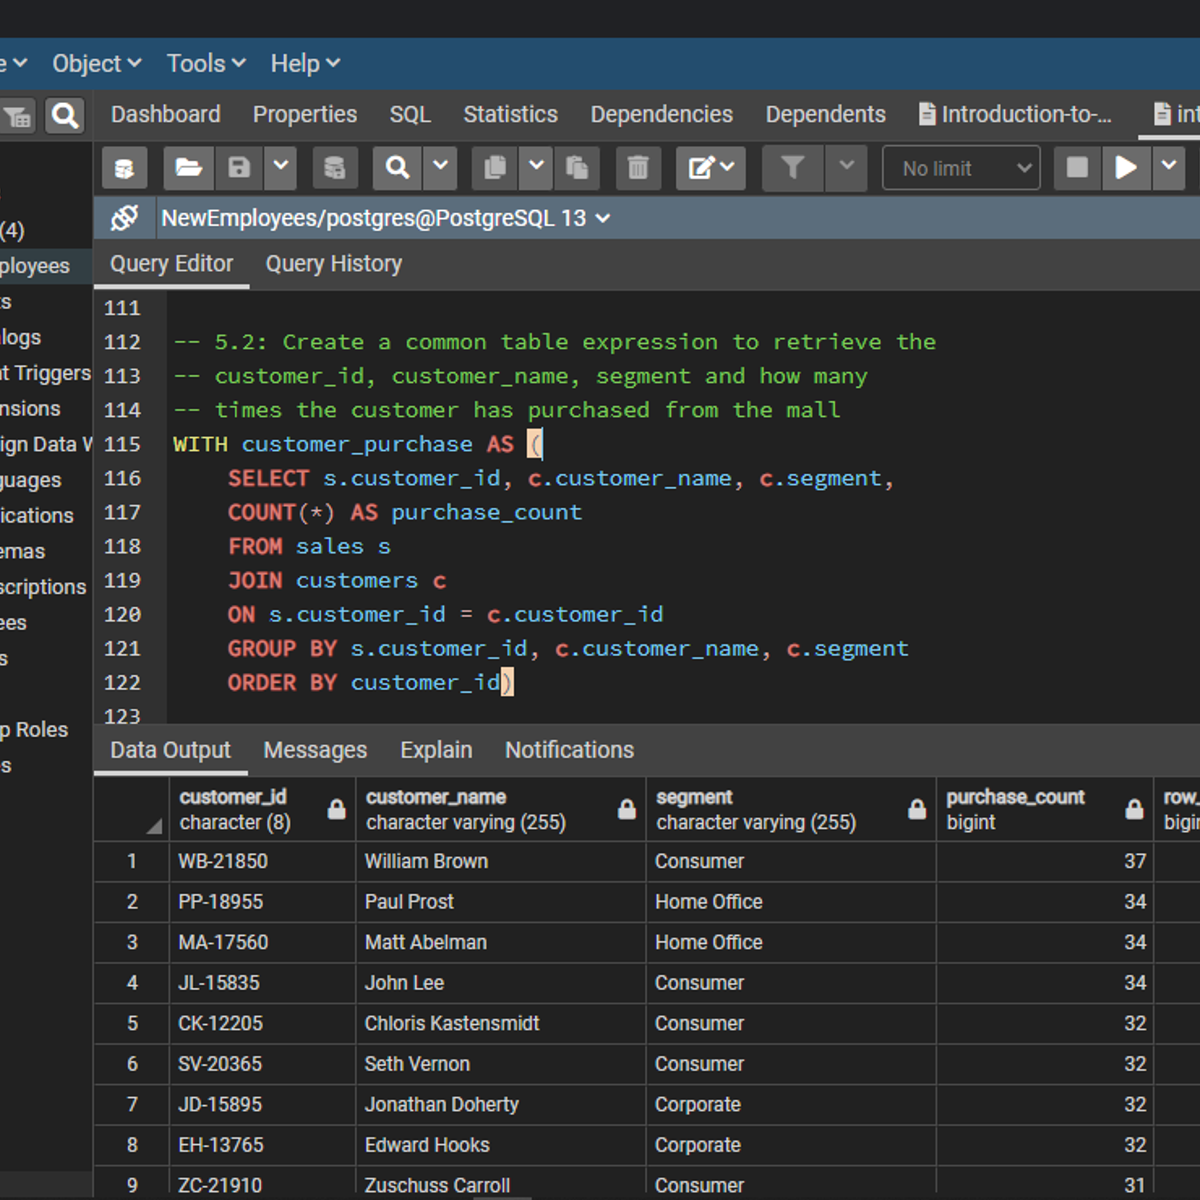
Introduction to SQL Window Functions
Welcome to this project-based course Introduction to SQL Window Functions. This is a hands-on project that introduces SQL users to the world of window functions. In this project, you will learn how to explore and query the project-db database extensively. We will start this hands-on project by retrieving the data in the table in the database.
By the end of this 2-hour-and-a-half-long project, you will be able to use different window functions to retrieve the desired result from a database. In this project, you will learn how to use SQL window functions like ROW_NUMBER(), LEAD(), LAG(), and FIRST_VALUE() to manipulate data in the project-db database. These window functions will be used together with the OVER() clause to query this database.
Fundamentals of Big Data
Welcome to Fundamentals of Big Data, the fourth course of the Key Technologies of Data Analytics specialization. By enrolling in this course, you are taking the next step in your career in data analytics. This course is the fourth of a series that aims to prepare you for a role working in data analytics. In this course, you will be introduced to many of the core concepts of big data. You will learn about the primary systems used in big data. We’ll go through phases of a common big data life cycle. This course covers a wide variety of topics that are critical for understanding big data and are designed to give you an introduction and overview as you begin to build relevant knowledge and skills.
Creating New BigQuery Datasets and Visualizing Insights
This is the second course in the Data to Insights course series. Here we will cover how to ingest new external datasets into BigQuery and visualize them with Google Data Studio. We will also cover intermediate SQL concepts like multi-table JOINs and UNIONs which will allow you to analyze data across multiple data sources.
Note: Even if you have a background in SQL, there are BigQuery specifics (like handling query cache and table wildcards) that may be new to you.
After completing this course, enroll in the Achieving Advanced Insights with BigQuery course.
>>> By enrolling in this specialization you agree to the Qwiklabs Terms of Service as set out in the FAQ and located at: https://qwiklabs.com/terms_of_service <<<
Accounting Data Analytics with Python
This course focuses on developing Python skills for assembling business data. It will cover some of the same material from Introduction to Accounting Data Analytics and Visualization, but in a more general purpose programming environment (Jupyter Notebook for Python), rather than in Excel and the Visual Basic Editor. These concepts are taught within the context of one or more accounting data domains (e.g., financial statement data from EDGAR, stock data, loan data, point-of-sale data).
The first half of the course picks up where Introduction to Accounting Data Analytics and Visualization left off: using in an integrated development environment to automate data analytic tasks. We discuss how to manage code and share results within Jupyter Notebook, a popular development environment for data analytic software like Python and R. We then review some fundamental programming skills, such as mathematical operators, functions, conditional statements and loops using Python software.
The second half of the course focuses on assembling data for machine learning purposes. We introduce students to Pandas dataframes and Numpy for structuring and manipulating data. We then analyze the data using visualizations and linear regression. Finally, we explain how to use Python for interacting with SQL data.
Nursing Informatics Training and Education
In this fourth of our five courses, I will go deeper into the training and education leadership skills that are helpful for nursing informatics leaders. I will also guide you through the process of preparing a course document or syllabus for the nursing informatics specialty both in academic settings and in practice or industry.
Following are the course objectives:
1. Describe relevant nursing informatics course development in clinical and academic settings to understand similarities and differences in informatics teaching and education across settings.
2. Describe informatics education and training needs for diverse participants with various experience levels to enable development of appropriate training and education materials.
3. Develop a prototype course syllabus and introductory recorded message to apply learning in a simulated setting.
4. Describe the benefits of formal and informal mentoring for nursing informaticians to advance career opportunities and support the nursing informatics specialty.
Logistic Regression for Classification using Julia
This guided project is about book genre classification using logistic regression in Julia. It is ideal for beginners who do not know what logistic regression is because this project explains these concepts in simple terms.
While you are watching me code, you will get a cloud desktop with all the required software pre-installed. This will allow you to code along with me. After all, we learn best with active, hands-on learning.
Special features:
1) Simple explanations of important concepts.
2) Use of images to aid in explanation.
3) Use a real world dataset.
Note: This project works best for learners who are based in the North America region. We’re currently working on providing the same experience in other regions.
Introduction to Data Analysis using Microsoft Excel
In this project, you will learn the foundation of data analysis with Microsoft Excel using sales data from a sample company. You will learn how to use sorting and filtering tools to reorganize your data and access specific information about your data. You will also learn about the use of functions like IF and VLOOKUP functions to create new data and relate data from different tables. Finally, you will learn how to create PivotTables to summarize and look at comparisons within your data. These skills will help you efficiently perform data analysis on many different types of data and give you the foundation to expand your toolbox as you explore other strategies for data analysis.
Applied Analytics and Data for Decision Making
By the end of this course, learners are prepared to identify and test the best solutions for improving performance and integrating concepts from operational excellence methodologies for optimum data-driven decision making. The course begins with a focus on deciphering the root cause of problems through a variety of tools before determining and assessing best-fit solutions. Learners discover how to apply ISO, Lean and Six Sigma in the pursuit of aligning organizational operations data with performance standards. Hospitality, manufacturing and e-commerce case studies help illustrate how to build data literacy while ensuring privacy and data ethics measures are in place.
Material features online lectures, videos, demos, project work, readings and discussions. This course is ideal for individuals keen on developing a data-driven mindset that derives powerful insights useful for improving a company’s bottom line. It is helpful if learners have some familiarity with reading reports, gathering and using data, and interpreting visualizations. It is the third course in the Data-Driven Decision Making (DDDM) specialization. To learn more about the specialization, check out a video overview at https://www.youtube.com/watch?v=Oi4mmeSWcVc&list=PLQvThJe-IglyYljMrdqwfsDzk56ncfoLx&index=11.
Popular Internships and Jobs by Categories
Find Jobs & Internships
Browse


© 2024 BoostGrad | All rights reserved