Back to Courses


Data Analysis Courses - Page 55
Showing results 541-550 of 998
Business Intelligence Concepts, Tools, and Applications
This is the fourth course in the Data Warehouse for Business Intelligence specialization. Ideally, the courses should be taken in sequence. Effectively and efficiently mining data is the very center of any modern business’s competitive strategy, and a data warehouse is a core component of this data mining. The ability to quickly look back at early trends and have the accurate data – properly formatted – is essential to good decision making. By enabling this historical overview, a data warehouse allows decision makers to learn from past trends and challenges. In essence, the benefit of a data warehouse is continuous improvement.
By the end of the course, you will be able to enhance Conformity And Quality of Data by gaining the knowledge and skills for using data warehouses for business intelligence purposes and for working as a business intelligence developer. You’ll have the opportunity to work with large data sets in a data warehouse environment and will learn the use of MicroStrategy's Online Analytical Processing (OLAP) and Visualization capabilities to create visualizations and dashboards.
The course gives an overview of how business intelligence technologies can support decision making across any number of business sectors. These technologies have had a profound impact on corporate strategy, performance, and competitiveness and broadly encompass decision support systems, business intelligence systems, and visual analytics. Modules are organized around the business intelligence concepts, tools, and applications, and the use of data warehouse for business reporting and online analytical processing, for creating visualizations and dashboards, and for business performance management and descriptive analytics.
This course is intended for business and computer science university students, IT professionals, program managers, business analysts and anyone with career interests in business intelligence.
In order to be successful in this course, you should have either completed Course 3 of the Data Warehousing for Business Intelligence Specialization or have some prior experience with data visualization and document management.
Advanced SQL Retrieval Queries in SQLiteStudio
In this course you will learn to write advanced SQL (Structured Query Language) retrieval queries using SQLiteStudio. Retrieving data from a relational database is one of the primary methods used by application and web developers to display data and populate web pages. Since a database can be made up of a complex combination of relational tables, retrieving that data can be challenging. You can meet those challenges by gaining experience with some of the more advanced SQL coding techniques. Through hands-on practice you will write SQL code to use functions and grouping, sub queries, calculated fields, and conditional expressions. In addition, you will experiment with alternative methods of joining tables for data retrieval.
Note: This course works best for learners who are based in the North America region. We’re currently working on providing the same experience in other regions.
Predict Visitor Purchases with a Classification Model in BQML
This is a self-paced lab that takes place in the Google Cloud console. In this lab, you will use a newly available ecommerce dataset to run some typical queries that businesses would want to know about their customers’ purchasing habits.
Advanced Portfolio Construction and Analysis with Python
The practice of investment management has been transformed in recent years by computational methods. Instead of merely explaining the science, we help you build on that foundation in a practical manner, with an emphasis on the hands-on implementation of those ideas in the Python programming language. In this course, we cover the estimation, of risk and return parameters for meaningful portfolio decisions, and also introduce a variety of state-of-the-art portfolio construction techniques that have proven popular in investment management and portfolio construction due to their enhanced robustness.
As we cover the theory and math in lecture videos, we'll also implement the concepts in Python, and you'll be able to code along with us so that you have a deep and practical understanding of how those methods work. By the time you are done, not only will you have a foundational understanding of modern computational methods in investment management, you'll have practical mastery in the implementation of those methods. If you follow along and implement all the lab exercises, you will complete the course with a powerful toolkit that you will be able to use to perform your own analysis and build your own implementations and perhaps even use your newly acquired knowledge to improve on current methods.
Relational Database Design
Have you ever wanted to build a database but don't know where to start? This course will provide you a step-by-step guidance. We are going to start from a raw idea to an implementable relational database. Getting on the path, practicing the real-life mini cases, you will be confident and comfortable with Relational Database Design. Let's get started!
Relational Database Design can be taken for academic credit as part of CU Boulder’s Master of Science in Data Science (MS-DS) degree offered on the Coursera platform. The MS-DS is an interdisciplinary degree that brings together faculty from CU Boulder’s departments of Applied Mathematics, Computer Science, Information Science, and others. With performance-based admissions and no application process, the MS-DS is ideal for individuals with a broad range of undergraduate education and/or professional experience in computer science, information science, mathematics, and statistics. Learn more about the MS-DS program at https://www.coursera.org/degrees/master-of-science-data-science-boulder.
Data Visualization with Advanced Excel
In this course, you will get hands-on instruction of advanced Excel 2013 functions. You’ll learn to use PowerPivot to build databases and data models. We’ll show you how to perform different types of scenario and simulation analysis and you’ll have an opportunity to practice these skills by leveraging some of Excel's built in tools including, solver, data tables, scenario manager and goal seek. In the second half of the course, will cover how to visualize data, tell a story and explore data by reviewing core principles of data visualization and dashboarding. You’ll use Excel to build complex graphs and Power View reports and then start to combine them into dynamic dashboards.
Note: Learners will need PowerPivot to complete some of the exercises. Please use MS Excel 2013 version. If you have other MS Excel versions or a MAC you might not be able to complete all assignments.
This course was created by PricewaterhouseCoopers LLP with an address at 300 Madison Avenue, New York, New York, 10017.
Predictive Modeling and Analytics
Welcome to the second course in the Data Analytics for Business specialization!
This course will introduce you to some of the most widely used predictive modeling techniques and their core principles. By taking this course, you will form a solid foundation of predictive analytics, which refers to tools and techniques for building statistical or machine learning models to make predictions based on data. You will learn how to carry out exploratory data analysis to gain insights and prepare data for predictive modeling, an essential skill valued in the business.
You’ll also learn how to summarize and visualize datasets using plots so that you can present your results in a compelling and meaningful way. We will use a practical predictive modeling software, XLMiner, which is a popular Excel plug-in. This course is designed for anyone who is interested in using data to gain insights and make better business decisions. The techniques discussed are applied in all functional areas within business organizations including accounting, finance, human resource management, marketing, operations, and strategic planning.
The expected prerequisites for this course include a prior working knowledge of Excel, introductory level algebra, and basic statistics.
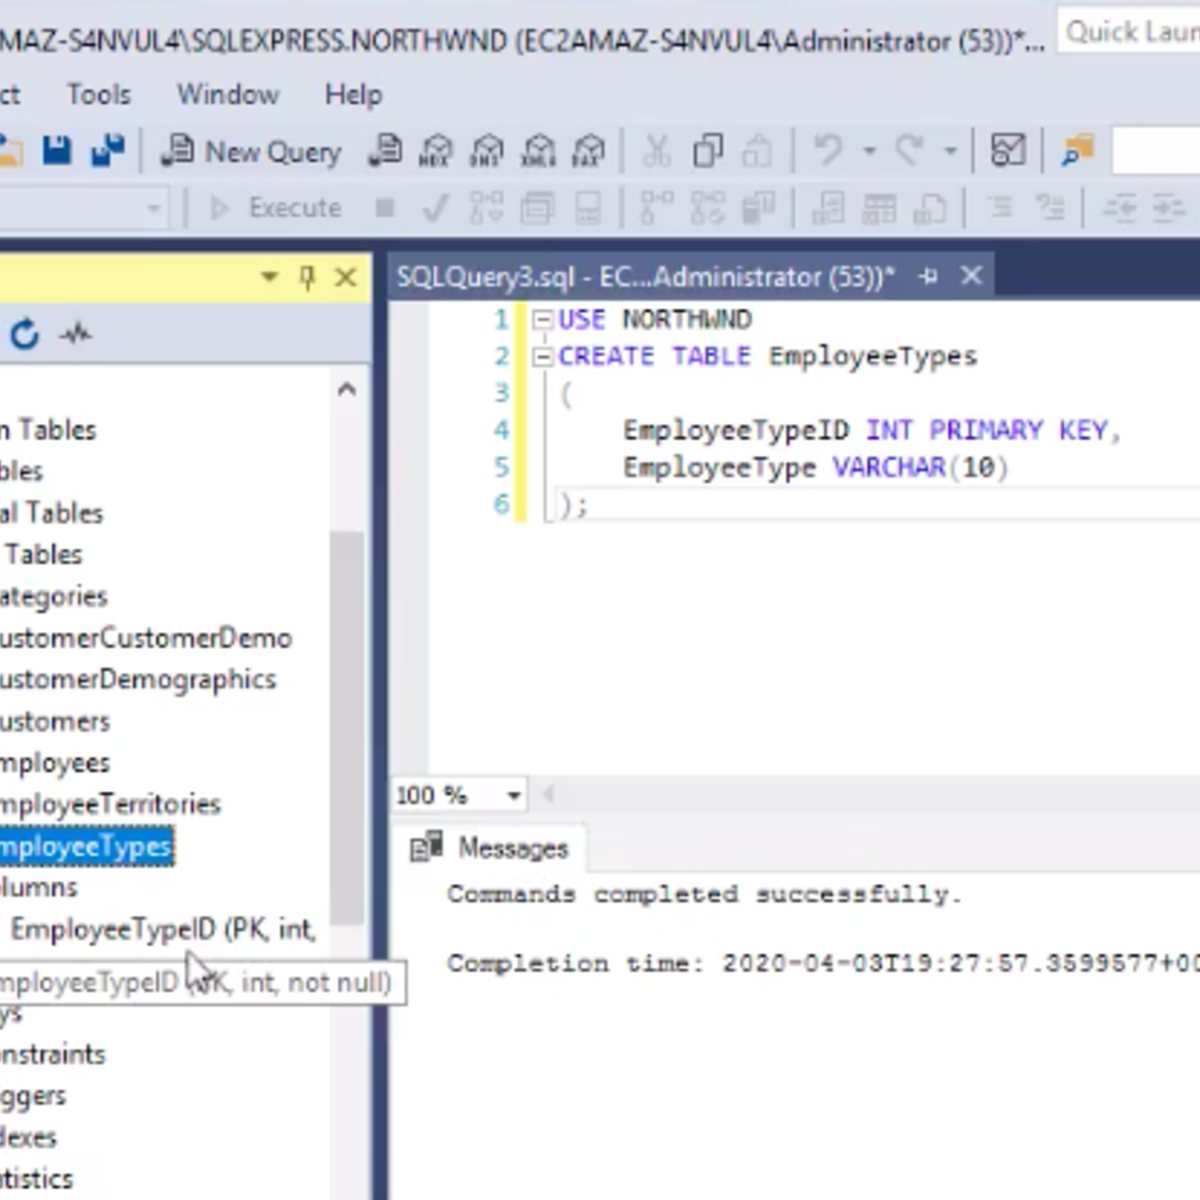
Building Basic Relational Databases in SQL Server Management Studio
In this one-hour based project you will apply the basics of working with relational databases within the SQL Server Management Studio (SSMS) environment. You will use the tools in SSMS to diagram an existing database and to create and run some SELECT and CREATE TABLE structured query language commands. You will also acquire the basic terminology that applies to all relational databases. By successfully completing the hands-on practices assigned, you will be better prepared for applying these basic concepts in SSMS in SQL Server classes.
Note: This course works best for learners who are based in the North America region. We’re currently working on providing the same experience in other regions.
Visualization for Data Journalism
While telling stories with data has been part of the news practice since its earliest days, it is in the midst of a renaissance. Graphics desks which used to be deemed as “the art department,” a subfield outside the work of newsrooms, are becoming a core part of newsrooms’ operation. Those people (they often have various titles: data journalists, news artists, graphic reporters, developers, etc.) who design news graphics are expected to be full-fledged journalists and work closely with reporters and editors. The purpose of this class is to learn how to think about the visual presentation of data, how and why it works, and how to doit the right way. We will learn how to make graphs like The New York Times, Vox, Pew, and FiveThirtyEight. In the end, you can share–embed your beautiful charts in publications, blog posts, and websites.
This course assumes you understand basic coding skills, preferably Python. However, we also provide a brief review on Python in Module 1, in case you want to refresh yourself on the basics and perform simple data analysis.
Using Data for Geographic Mapping and Forecasting in SAS Visual Analytics
In this course, you learn about the data structure needed for geographic mapping and forecasting, how to use SAS Data Studio to restructure data for analysis, and how to create geo maps and forecasts in SAS Visual Analytics.
Popular Internships and Jobs by Categories
Find Jobs & Internships
Browse


© 2024 BoostGrad | All rights reserved