Back to Courses


Data Analysis Courses - Page 50
Showing results 491-500 of 998
Data Scientist Career Guide and Interview Preparation
This course is designed to prepare you to enter the job market as a data scientist. It provides guidance about the regular functions and tasks of data scientists and their place in the data ecosystem, as well as the opportunities of the profession and some options for career development. It explains practical techniques for creating essential job-seeking materials such as a resume and a portfolio, as well as auxiliary tools like a cover letter and an elevator pitch. You will learn how to find and assess prospective job positions, apply to them, and lay the groundwork for interviewing. You will also get inside tips and steps you can use to perform professionally and effectively at interviews. Let seasoned professionals share their experience to help you get ahead of the competition.
The Apps Script CLI - clasp
This is a self-paced lab that takes place in the Google Cloud console. The Apps Script CLI, or clasp, is a tool that lets you create, edit, and deploy Apps Script projects locally and create and publish web apps and add-ons for products like Sheets, Docs, Forms, and Slides from the command line.
Modern Regression Analysis in R
This course will provide a set of foundational statistical modeling tools for data science. In particular, students will be introduced to methods, theory, and applications of linear statistical models, covering the topics of parameter estimation, residual diagnostics, goodness of fit, and various strategies for variable selection and model comparison. Attention will also be given to the misuse of statistical models and ethical implications of such misuse.
This course can be taken for academic credit as part of CU Boulder’s Master of Science in Data Science (MS-DS) degree offered on the Coursera platform. The MS-DS is an interdisciplinary degree that brings together faculty from CU Boulder’s departments of Applied Mathematics, Computer Science, Information Science, and others. With performance-based admissions and no application process, the MS-DS is ideal for individuals with a broad range of undergraduate education and/or professional experience in computer science, information science, mathematics, and statistics. Learn more about the MS-DS program at https://www.coursera.org/degrees/master-of-science-data-science-boulder.
Logo adapted from photo by Vincent Ledvina on Unsplash
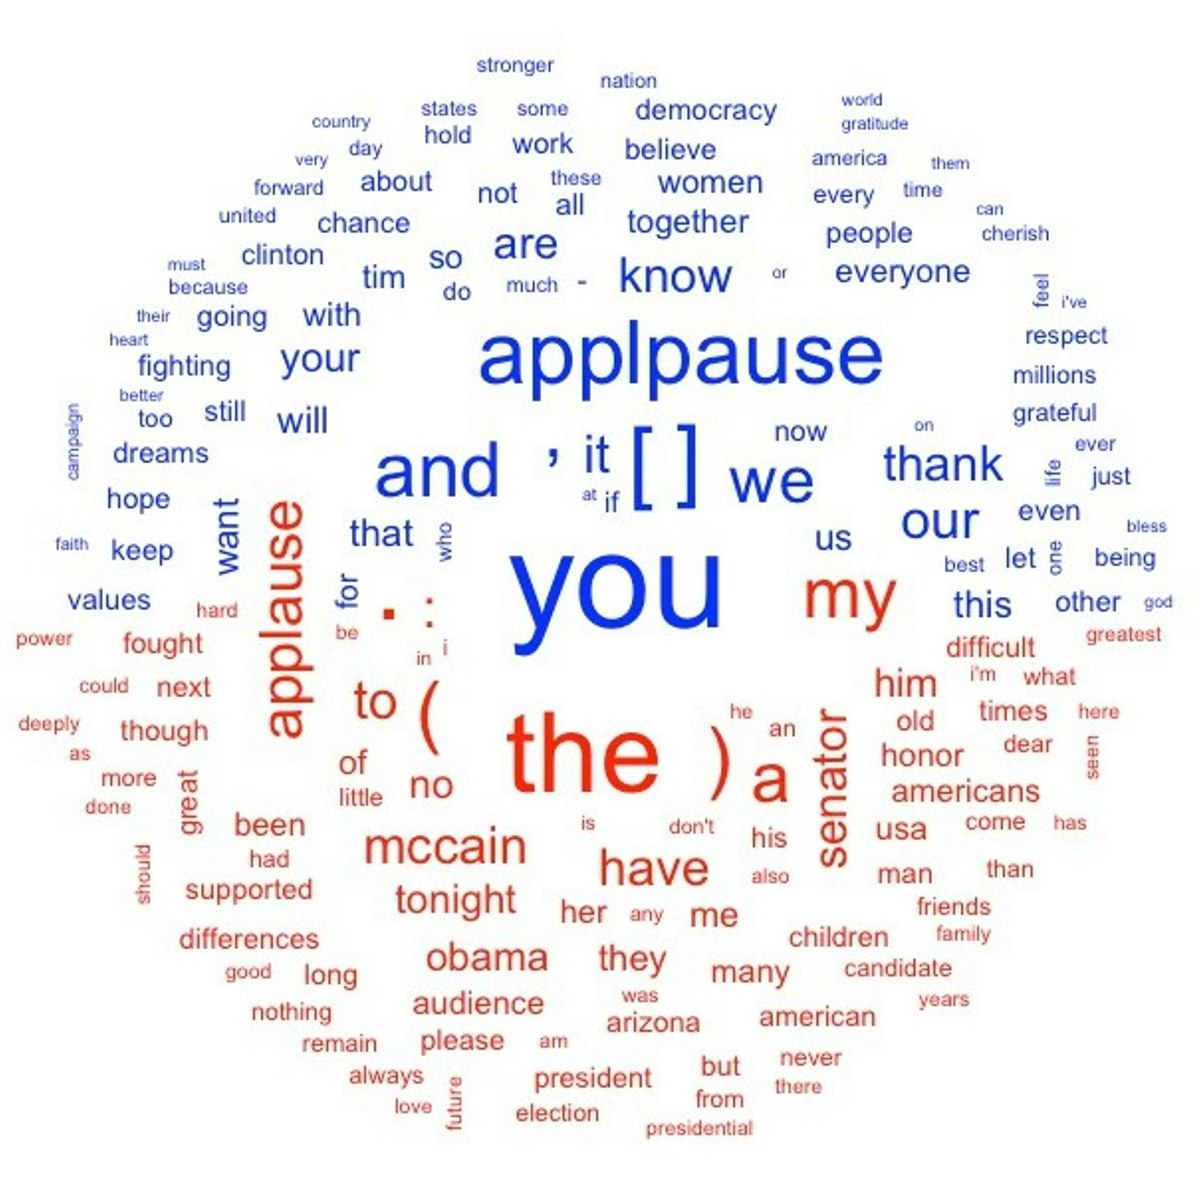
Exploratory Data Analysis with Textual Data in R / Quanteda
In this 1-hour long project-based course, you will learn how to explore presidential concession speeches by US presidential candidates over time, looking specifically at speech length and top words and examining variation by Democrat and Republican candidates. You will learn how to import textual data stored in raw text files, turn these files into a corpus (a collection of textual documents) and tokenize the text all using the software package quanteda. You will also learn how to extract useful information from filenames and how to use this information to generate visualizations of textual data using the stringr and ggplot2 packages.
Note: This course works best for learners who are based in the North America region. We’re currently working on providing the same experience in other regions.
Introduction to Reproducibility in Cancer Informatics
The course is intended for students in the biomedical sciences and researchers who use informatics tools in their research and have not had training in reproducibility tools and methods.
This course is written for individuals who:
- Have some familiarity with R or Python - have written some scripts.
- Have not had formal training in computational methods.
- Have limited or no familiar with GitHub, Docker, or package management tools.
Motivation
Data analyses are generally not reproducible without direct contact with the original researchers and a substantial amount of time and effort (BeaulieuJones et al, 2017). Reproducibility in cancer informatics (as with other fields) is still not monitored or incentivized despite that it is fundamental to the scientific method. Despite the lack of incentive, many researchers strive for reproducibility in their own work but often lack the skills or training to do so effectively.
Equipping researchers with the skills to create reproducible data analyses increases the efficiency of everyone involved. Reproducible analyses are more likely to be understood, applied, and replicated by others. This helps expedite the scientific process by helping researchers avoid false positive dead ends. Open source clarity in reproducible methods also saves researchers' time so they don't have to reinvent the proverbial wheel for methods that everyone in the field is already performing.
Curriculum
This course introduces the concepts of reproducibility and replicability in the context of cancer informatics. It uses hands-on exercises to demonstrate in practical terms how to increase the reproducibility of data analyses. The course also introduces tools relevant to reproducibility including analysis notebooks, package managers, git and GitHub.
The course includes hands-on exercises for how to apply reproducible code concepts to their code. Individuals who take this course are encouraged to complete these activities as they follow along with the course material to help increase the reproducibility of their analyses.
**Goal of this course:**
Equip learners with reproducibility skills they can apply to their existing analyses scripts and projects. This course opts for an "ease into it" approach. We attempt to give learners doable, incremental steps to increase the reproducibility of their analyses.
**What is not the goal**
This course is meant to introduce learners to the reproducibility tools, but _it does not necessarily represent the absolute end-all, be-all best practices for the use of these tools_. In other words, this course gives a starting point with these tools, but not an ending point. The advanced version of this course is the next step toward incrementally "better practices".
How to use the course
This course is designed with busy professional learners in mind -- who may have to pick up and put down the course when their schedule allows.
Each exercise has the option for you to continue along with the example files as you've been editing them in each chapter, OR you can download fresh chapter files that have been edited in accordance with the relative part of the course. This way, if you decide to skip a chapter or find that your own files you've been working on no longer make sense, you have a fresh starting point at each exercise.
Applying Data Analytics in Finance
This course introduces an overview of financial analytics. You will learn why, when, and how to apply financial analytics in real-world situations. You will explore techniques to analyze time series data and how to evaluate the risk-reward trade off expounded in modern portfolio theory. While most of the focus will be on the prices, returns, and risk of corporate stocks, the analytical techniques can be leverages in other domains. Finally, a short introduction to algorithmic trading concludes the course.
After completing this course, you should be able to understand time series data, create forecasts, and determine the efficacy of the estimates. Also, you will be able to create a portfolio of assets using actual stock price data while optimizing risk and reward. Understanding financial data is an important skill as an analyst, manager, or consultant.
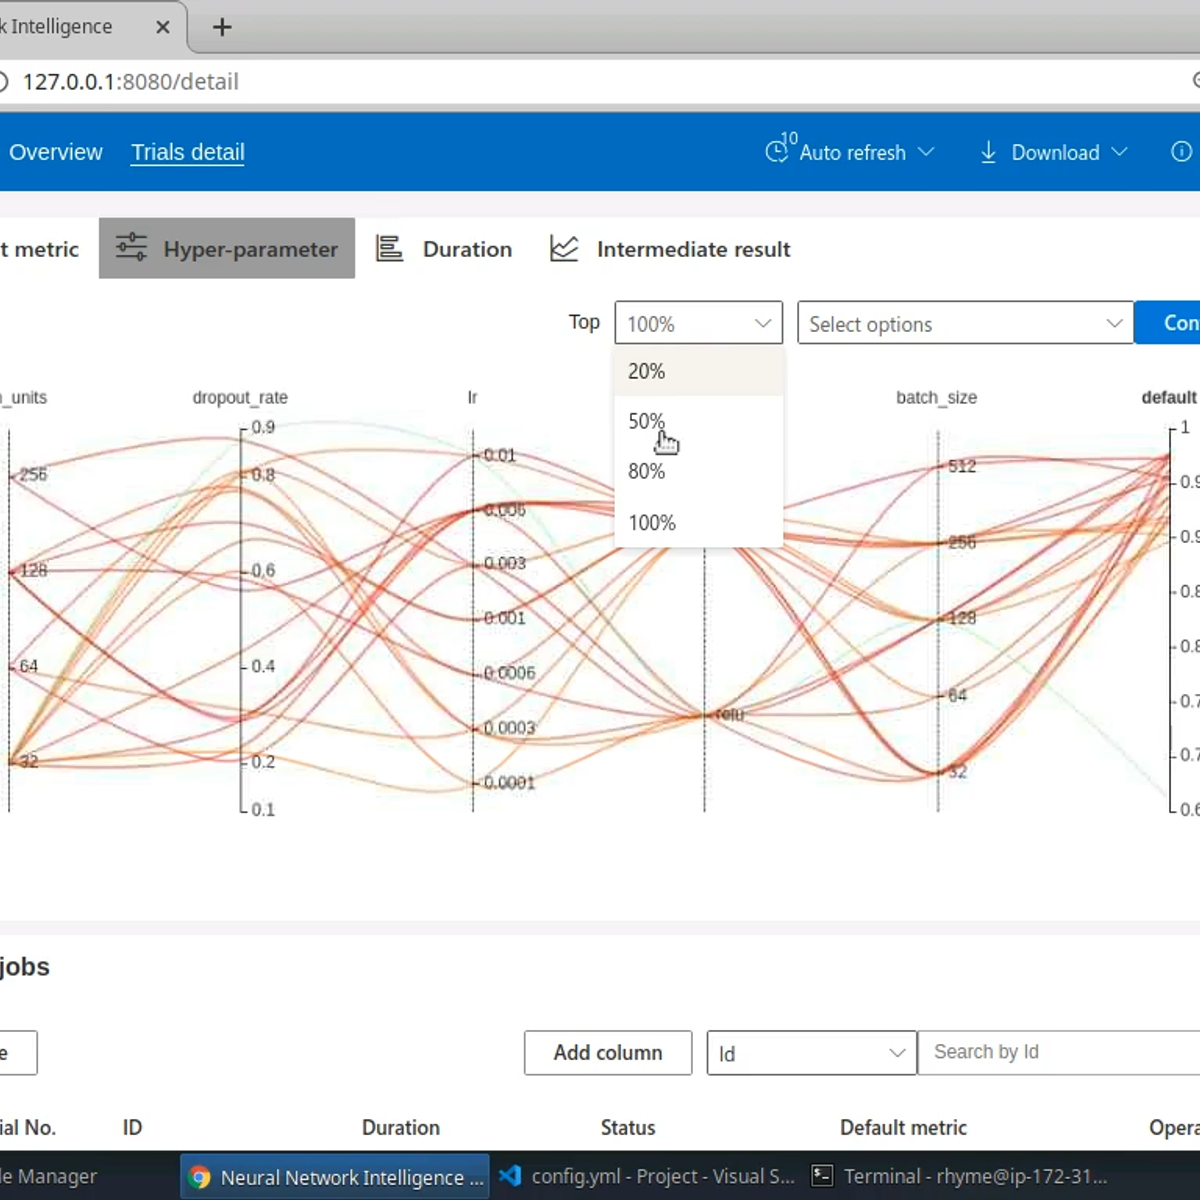
Hyperparameter Tuning with Neural Network Intelligence
In this 2-hour long guided project, we will learn the basics of using Microsoft's Neural Network Intelligence (NNI) toolkit and will use it to run a Hyperparameter tuning experiment on a Neural Network. NNI is an open source, AutoML toolkit created by Microsoft which can help machine learning practitioners automate Feature engineering, Hyperparameter tuning, Neural Architecture search and Model compression. In this guided project, we are going to take a look at using NNI to perform hyperparameter tuning. Please note that we are going to learn to use the NNI toolkit for hyperparameter tuning, and are not going to implement the tuning algorithms ourselves. We will use the popular MNIST dataset and train a simple Neural Network to learn to classify images of hand-written digits from the dataset. Once a basic script is in place, we will use the NNI toolkit to run a hyperparameter tuning experiment to find optimal values for batch size, learning rate, choice of activation function for the hidden layer, number of hidden units for the hidden layer, and dropout rate for the dropout layer.
To be able to complete this project successfully, you should be familiar with the Python programming language. You should also be familiar with Neural Networks, TensorFlow and Keras.
Note: This course works best for learners who are based in the North America region. We’re currently working on providing the same experience in other regions.
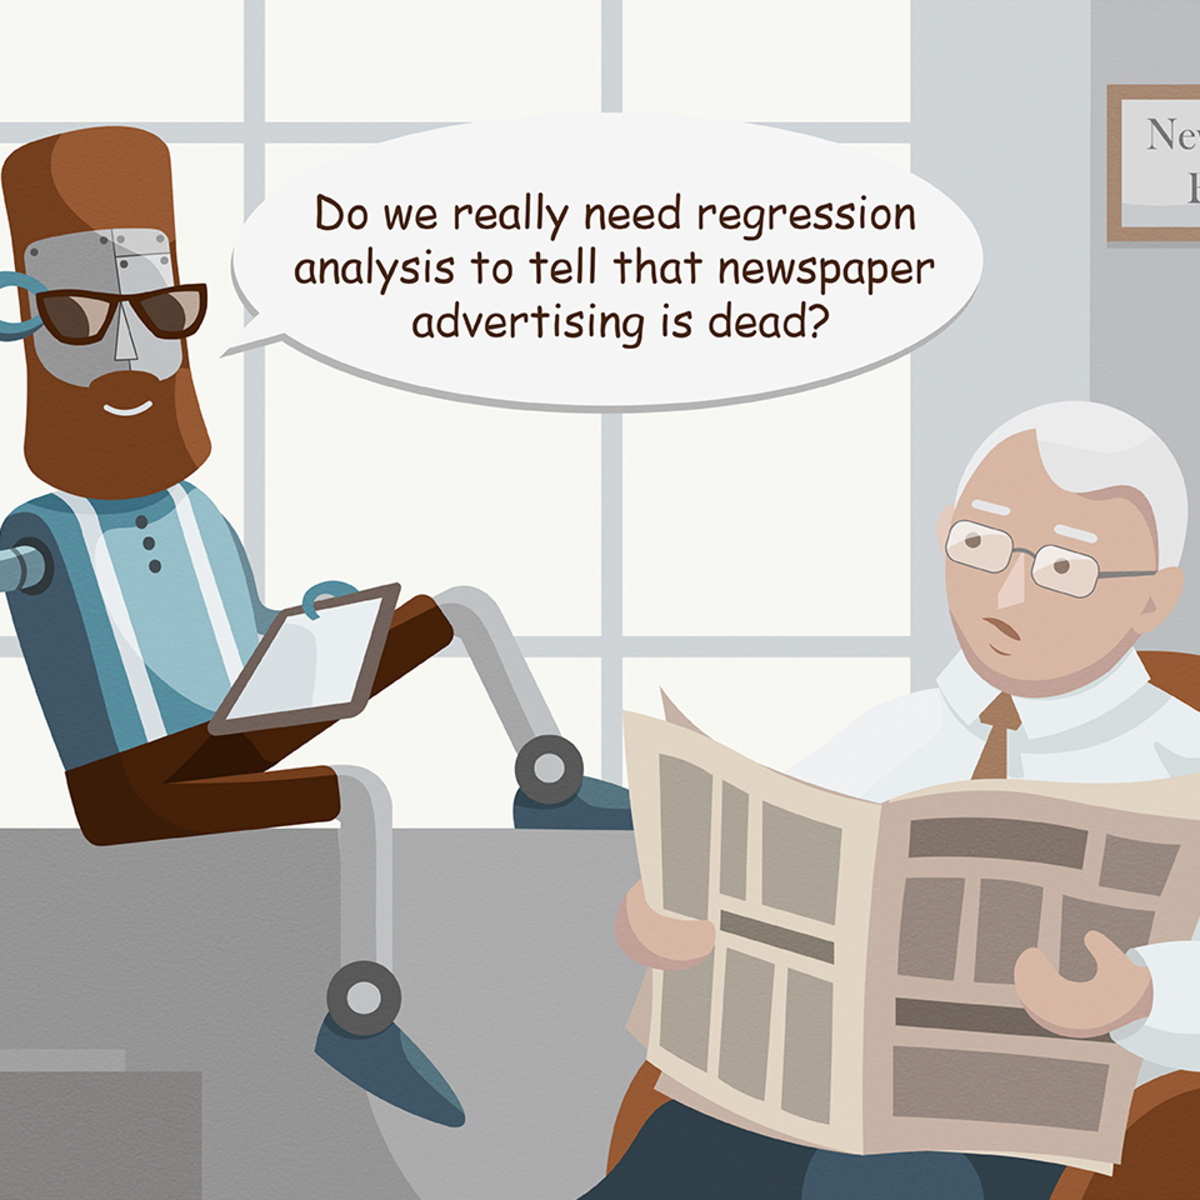
Predict Sales Revenue with scikit-learn
In this 2-hour long project-based course, you will build and evaluate a simple linear regression model using Python. You will employ the scikit-learn module for calculating the linear regression, while using pandas for data management, and seaborn for plotting. You will be working with the very popular Advertising data set to predict sales revenue based on advertising spending through mediums such as TV, radio, and newspaper.
By the end of this course, you will be able to:
- Explain the core ideas of linear regression to technical and non-technical audiences
- Build a simple linear regression model in Python with scikit-learn
- Employ Exploratory Data Analysis (EDA) to small data sets with seaborn and pandas
- Evaluate a simple linear regression model using appropriate metrics
This course runs on Coursera's hands-on project platform called Rhyme. On Rhyme, you will get instant access to pre-configured cloud desktops containing all of the software and data you need for the project. Everything is already set up directly in your internet browser so you can just focus on learning. For this project, you’ll get instant access to a cloud desktop with Jupyter and Python 3.7 with all the necessary libraries pre-installed.
Notes:
- You will be able to access the cloud desktop 5 times. However, you will be able to access instructions videos as many times as you want.
- This course works best for learners who are based in the North America region. We’re currently working on providing the same experience in other regions.
Business Intelligence and Competitive Analysis
By the end of 2019, it is clear that American Airlines (AAL), the world’s largest airline group and a SP500 company, is in trouble. With the growth rate of its stock price ranked at the bottom of all major US airlines and going in the opposite direction from the SP500 index, AAL needs to find out what is going on, and how to turn the company and its stock price around.
Addressing the challenge faced by AAL may well be a large-scale management consulting project. To start, business intelligence and competitive analysis (or competitive intelligence for short) is required to discover the problems and opportunities for the company which lay the foundation for the turning-around strategies.
In this course, you will gain the knowledge and skills to combine data, analytics models and visualization tools for effective and efficient competitive intelligence. Upon completion of the course, you should be able to conduct competitive intelligence on companies of your choice as a management consultant.
Note: To gain hands-on experiences in competitive intelligence via data analytics, you need to get into action. To this end, this course utilizes an external website (free) for you to practice the skills learned.
Exploratory vs Confirmatory data analysis using Python
This Guided Project, Exploratory and Confirmatory Data Analysis using python, is for those who want to learn about different methods of data analysis. In this 2-hour-long project-based course, you will understand and apply Exploratory Data Analysis, build different Data visualizations, apply different exploration techniques based on the data at hand and define and understand the concept of Confirmatory Data Analysis.
This project is unique because you will learn how and where to start your data exploration. You will also learn how to implement different data visualizations using python and when to use them. To be successful in this project, you will need to be experienced in python programming language and working with jupyter notebook environment.
Let's get started!
Popular Internships and Jobs by Categories
Find Jobs & Internships
Browse


© 2024 BoostGrad | All rights reserved