Back to Courses


Data Analysis Courses - Page 51
Showing results 501-510 of 998
Meaningful Marketing Insights
With marketers are poised to be the largest users of data within the organization, there is a need to make sense of the variety of consumer data that the organization collects. Surveys, transaction histories and billing records can all provide insight into consumers’ future behavior, provided that they are interpreted correctly. In Introduction to Marketing Analytics, we introduce the tools that learners will need to convert raw data into marketing insights. The included exercises are conducted using Microsoft Excel, ensuring that learners will have the tools they need to extract information from the data available to them. The course provides learners with exposure to essential tools including exploratory data analysis, as well as regression methods that can be used to investigate the impact of marketing activity on aggregate data (e.g., sales) and on individual-level choice data (e.g., brand choices).
To successfully complete the assignments in this course, you will require Microsoft Excel. If you do not have Excel, you can download a free 30-day trial here: https://products.office.com/en-us/try
Explainable Machine Learning with LIME and H2O in R
Welcome to this hands-on, guided introduction to Explainable Machine Learning with LIME and H2O in R. By the end of this project, you will be able to use the LIME and H2O packages in R for automatic and interpretable machine learning, build classification models quickly with H2O AutoML and explain and interpret model predictions using LIME.
Machine learning (ML) models such as Random Forests, Gradient Boosted Machines, Neural Networks, Stacked Ensembles, etc., are often considered black boxes. However, they are more accurate for predicting non-linear phenomena due to their flexibility. Experts agree that higher accuracy often comes at the price of interpretability, which is critical to business adoption, trust, regulatory oversight (e.g., GDPR, Right to Explanation, etc.). As more industries from healthcare to banking are adopting ML models, their predictions are being used to justify the cost of healthcare and for loan approvals or denials. For regulated industries that use machine learning, interpretability is a requirement. As Finale Doshi-Velez and Been Kim put it, interpretability is "The ability to explain or to present in understandable terms to a human.".
To successfully complete the project, we recommend that you have prior experience with programming in R, basic machine learning theory, and have trained ML models in R.
Note: This course works best for learners who are based in the North America region. We’re currently working on providing the same experience in other regions.
Measuring Total Data Quality
By the end of this second course in the Total Data Quality Specialization, learners will be able to:
1. Learn various metrics for evaluating Total Data Quality (TDQ) at each stage of the TDQ framework.
2. Create a quality concept map that tracks relevant aspects of TDQ from a particular application or data source.
3. Think through relative trade-offs between quality aspects, relative costs and practical constraints imposed by a particular project or study.
4. Identify relevant software and related tools for computing the various metrics.
5. Understand metrics that can be computed for both designed and found/organic data.
6. Apply the metrics to real data and interpret their resulting values from a TDQ perspective.
This specialization as a whole aims to explore the Total Data Quality framework in depth and provide learners with more information about the detailed evaluation of total data quality that needs to happen prior to data analysis. The goal is for learners to incorporate evaluations of data quality into their process as a critical component for all projects. We sincerely hope to disseminate knowledge about total data quality to all learners, such as data scientists and quantitative analysts, who have not had sufficient training in the initial steps of the data science process that focus on data collection and evaluation of data quality. We feel that extensive knowledge of data science techniques and statistical analysis procedures will not help a quantitative research study if the data collected/gathered are not of sufficiently high quality.
This specialization will focus on the essential first steps in any type of scientific investigation using data: either generating or gathering data, understanding where the data come from, evaluating the quality of the data, and taking steps to maximize the quality of the data prior to performing any kind of statistical analysis or applying data science techniques to answer research questions. Given this focus, there will be little material on the analysis of data, which is covered in myriad existing Coursera specializations. The primary focus of this specialization will be on understanding and maximizing data quality prior to analysis.
Fundamentals of Data Analytics in the Public Sector with R
Gain a foundational understanding of key terms and concepts in public administration and public policy while learning foundational programming techniques using the R programming language. You will learn how to execute functions to load, select, filter, mutate, and summarize data frames using the tidyverse libraries with an emphasis on the dplyr package. By the end of the course, you will create custom functions and apply them to population data which is commonly found in public sector analytics.
Throughout the course, you will work with authentic public datasets, and all programming can be completed in RStudio on the Coursera platform without additional software.
This is the first of four courses within the Data Analytics in the Public Sector with R Specialization. The series is ideal for current or early career professionals working in the public sector looking to gain skills in analyzing public data effectively. It is also ideal for current data analytics professionals or students looking to enter the public sector.
Introduction to Data Science and scikit-learn in Python
This course will teach you how to leverage the power of Python and artificial intelligence to create and test hypothesis. We'll start for the ground up, learning some basic Python for data science before diving into some of its richer applications to test our created hypothesis. We'll learn some of the most important libraries for exploratory data analysis (EDA) and machine learning such as Numpy, Pandas, and Sci-kit learn. After learning some of the theory (and math) behind linear regression, we'll go through and full pipeline of reading data, cleaning it, and applying a regression model to estimate the progression of diabetes. By the end of the course, you'll apply a classification model to predict the presence/absence of heart disease from a patient's health data.
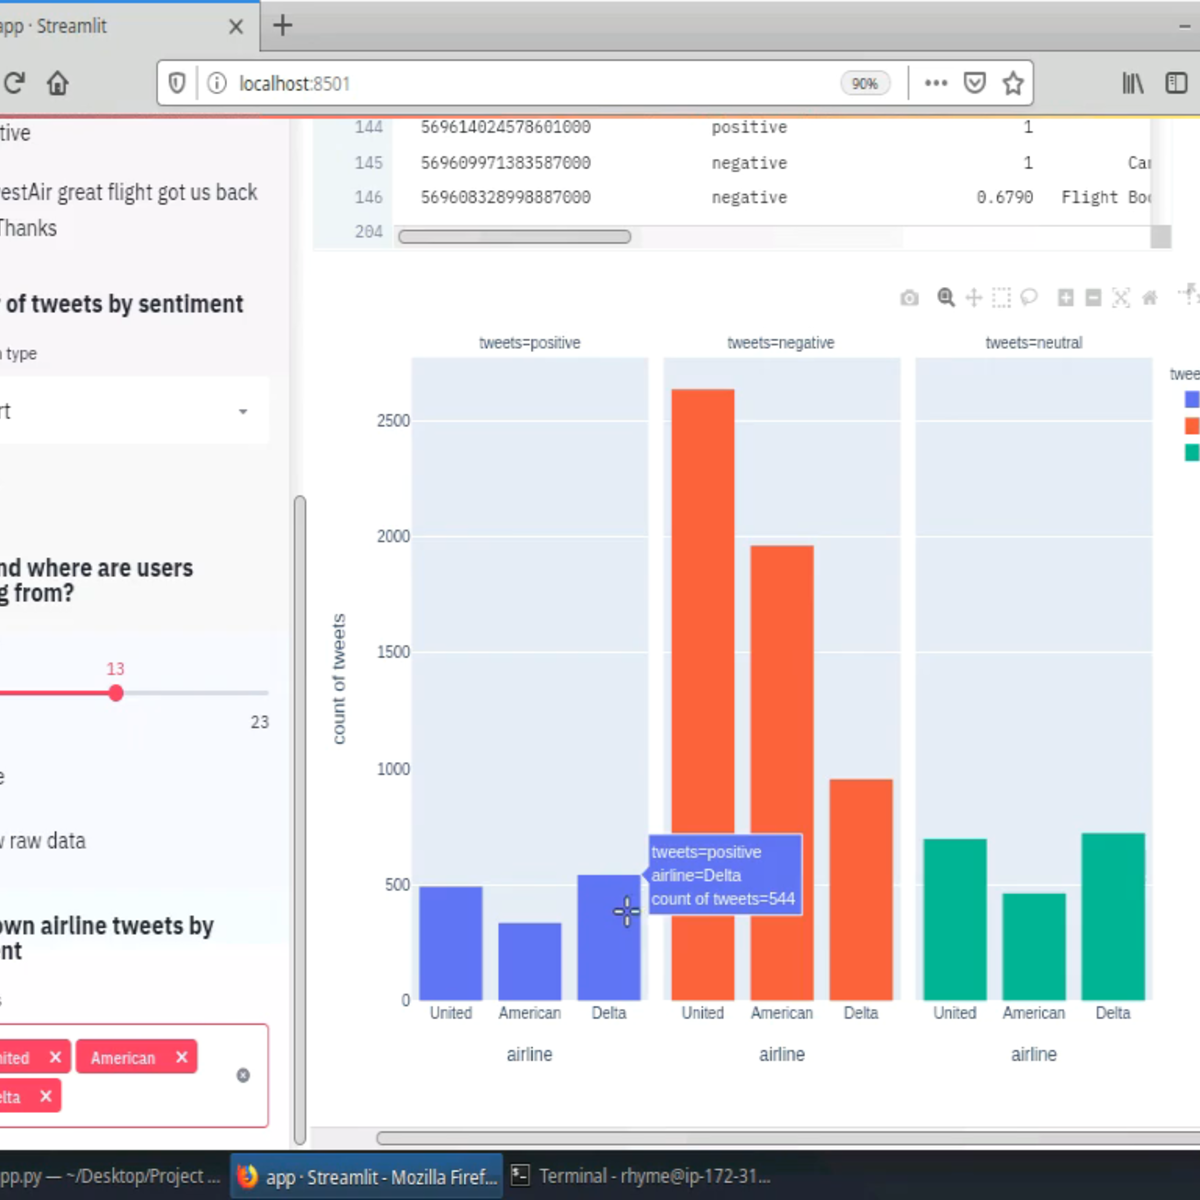
Create Interactive Dashboards with Streamlit and Python
Welcome to this hands-on project on building your first interactive, data dashboard with the Streamlit library in Python. By the end of this project, you are going to be comfortable with using Python and Streamlit to build beautiful and interactive dashboards and web apps, all with zero web development experience! We are going to load, explore, visualize and interact with data, and generate dashboards in less than 150 lines of Python code!
Prior experience with writing simple Python scripts and using pandas for data manipulation is recommended.
Note: This course works best for learners who are based in the North America region. We’re currently working on providing the same experience in other regions.
Troubleshooting Common SQL Errors with BigQuery
This is a self-paced lab that takes place in the Google Cloud console. In this lab, you use BigQuery to troubleshoot common SQL errors, query the data-to-insights public dataset, use the Query Validator, and troubleshoot syntax and logical SQL errors.
تحليل البيانات باستخدام البرمجة R
هذه هي الدورة التدريبية السابعة في شهادة تحليلات البيانات من Google. ستزودك هذه الدورات بالمهارات اللازمة للتقدم لوظائف محلل البيانات على المستوى التمهيدي. في هذه الدورة، ستتعرف على لغة البرمجة المعروفة باسم R. حيث ستتعرف على كيفية استخدام RStudio، وهي البيئة التي تتيح لك استخدام R. كما ستتناول هذه الدورة أيضًا تطبيقات البرامج والأدوات التي تنفرد بها R، مثل حزم R. ستكتشف كيف تتيح لك لغة R تنظيف البيانات وتنظيمها وتحليلها وتصورها والإبلاغ عنها بطرق جديدة وأكثر فاعلية. سيستمر محللو بيانات Google الحاليون بإرشادك وتزويدك بالطرق العملية لإنجاز مهام محلل البيانات الشائعة باستخدام أفضل الأدوات والموارد.
سيتم تجهيز المتعلمين الذين يكملون برنامج الشهادة هذا للتقدم لوظائف المستوى التمهيدي كمحللين بيانات. لا تلزم خبرة سابقة.
بنهاية هذه الدورة، ستكون قادرًا على:
- فحص فوائد استخدام لغة البرمجة R.
- اكتشاف كيفية استخدام RStudio لتطبيق R على تحليلك.
- استكشاف المفاهيم الأساسية المرتبطة بالبرمجة في R.
- استكشاف محتويات ومكونات حزم R بما في ذلك حزمة Tidyverse.
- اكتساب فهم لأطر البيانات واستخدامها في R.
- اكتشاف خيارات إنشاء التصورات في R.
- التعرف على R Markdown لتوثيق برمجة R.
Creating a Budget with Microsoft Excel
By the end of this project, you will learn how to create a budget template in an Excel Spreadsheet by using a free version of Microsoft Office Excel.
Excel is a spreadsheet that is similar in layout as accounting spreadsheets. It consists of individual cells that can be used to build functions, formulas, tables, and graphs that easily organize and analyze large amounts of information and data. While a budget helps you stay within estimated costs and expenses for either a business or a family. We will learn to create a budget both automatically and manually, step by step. By utilizing Microsoft Excel you will reduce the burden of budgeting and see increase in accuracy. It will allow you to scale budgeting and to make record keeping and tracking of expenditures easier. We will also use basic graphing for presenting budget tracking. You do not need to be an advance user of Microsoft Excel as we will show you how to use templates that are provided in the program and simple formulas to create a budget for any reason.
The R Programming Environment
This course provides a rigorous introduction to the R programming language, with a particular focus on using R for software development in a data science setting. Whether you are part of a data science team or working individually within a community of developers, this course will give you the knowledge of R needed to make useful contributions in those settings. As the first course in the Specialization, the course provides the essential foundation of R needed for the following courses. We cover basic R concepts and language fundamentals, key concepts like tidy data and related "tidyverse" tools, processing and manipulation of complex and large datasets, handling textual data, and basic data science tasks. Upon completing this course, learners will have fluency at the R console and will be able to create tidy datasets from a wide range of possible data sources.
Popular Internships and Jobs by Categories
Find Jobs & Internships
Browse


© 2024 BoostGrad | All rights reserved