Back to Courses


Data Science Courses - Page 89
Showing results 881-890 of 1407
GIS, Mapping, and Spatial Analysis Capstone
In this capstone course, you will apply everything you have learned by designing and then completing your own GIS project. You will plan out your project by writing a brief proposal that explains what you plan to do and why. You will then find data for a topic and location of your choice, and perform analysis and create maps that allow you to try out different tools and data sets. The results of your work will be assembled into an Esri story map, which is a web site with maps, images, text, and video. The goal is for you to have a finished product that you can share, and that demonstrates what you have learned.
Note: software is not provided for this course.
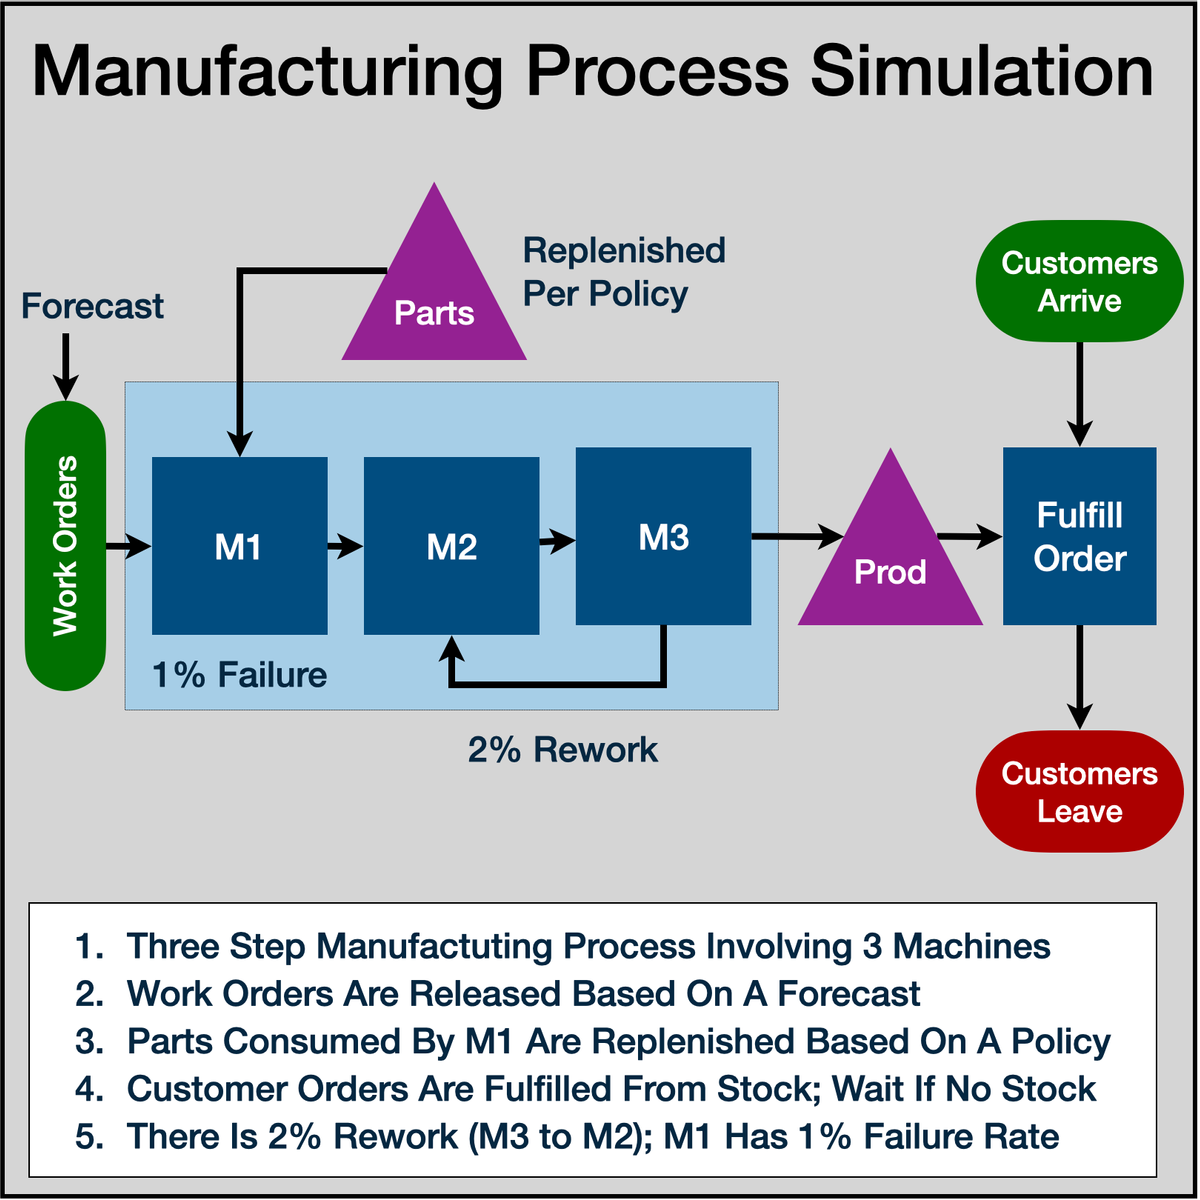
Simulation of Manufacturing Process Using R Simmer
Welcome to "Simulation of Manufacturing Process Using R Simmer". This is a project-based course which should take about 2 hours to finish. Before diving into the project, please take a look at the course objectives and structure. By the end of this project, you will gain introductiory knowledge of Discrete Event Simulation, Manufacturing Process Analysis, be able to use R Studio and Simmer library, create statistical variables required for simulation, define process trajectory, define and assign resources, define arrivals (eg. incoming customers / work units), run simulation in R, store results in data frames, plot charts and interpret the results.
Neural Networks and Deep Learning
In the first course of the Deep Learning Specialization, you will study the foundational concept of neural networks and deep learning.
By the end, you will be familiar with the significant technological trends driving the rise of deep learning; build, train, and apply fully connected deep neural networks; implement efficient (vectorized) neural networks; identify key parameters in a neural network’s architecture; and apply deep learning to your own applications.
The Deep Learning Specialization is our foundational program that will help you understand the capabilities, challenges, and consequences of deep learning and prepare you to participate in the development of leading-edge AI technology. It provides a pathway for you to gain the knowledge and skills to apply machine learning to your work, level up your technical career, and take the definitive step in the world of AI.
Data Engineering with MS Azure Synapse Apache Spark Pools
In this course, you will learn how to perform data engineering with Azure Synapse Apache Spark Pools, which enable you to boost the performance of big-data analytic applications by in-memory cluster computing.
You will learn how to differentiate between Apache Spark, Azure Databricks, HDInsight, and SQL Pools and understand the use-cases of data-engineering with Apache Spark in Azure Synapse Analytics. You will also learn how to ingest data using Apache Spark Notebooks in Azure Synapse Analytics and transform data using DataFrames in Apache Spark Pools in Azure Synapse Analytics. You will integrate SQL and Apache Spark pools in Azure Synapse Analytics. You will also learn how to monitor and manage data engineering workloads with Apache Spark in Azure Synapse Analytics.
This course is part of a Specialization intended for Data engineers and developers who want to demonstrate their expertise in designing and implementing data solutions that use Microsoft Azure data services for anyone interested in preparing for the Exam DP-203: Data Engineering on Microsoft Azure (beta). You will take a practice exam that covers key skills measured by the certification exam.
This is the sixth course in a program of 10 courses to help prepare you to take the exam so that you can have expertise in designing and implementing data solutions that use Microsoft Azure data services. The Data Engineering on Microsoft Azure exam is an opportunity to prove knowledge expertise in integrating, transforming, and consolidating data from various structured and unstructured data systems into structures that are suitable for building analytics solutions that use Microsoft Azure data services. Each course teaches you the concepts and skills that are measured by the exam.
By the end of this Specialization, you will be ready to take and sign-up for the Exam DP-203: Data Engineering on Microsoft Azure (beta).
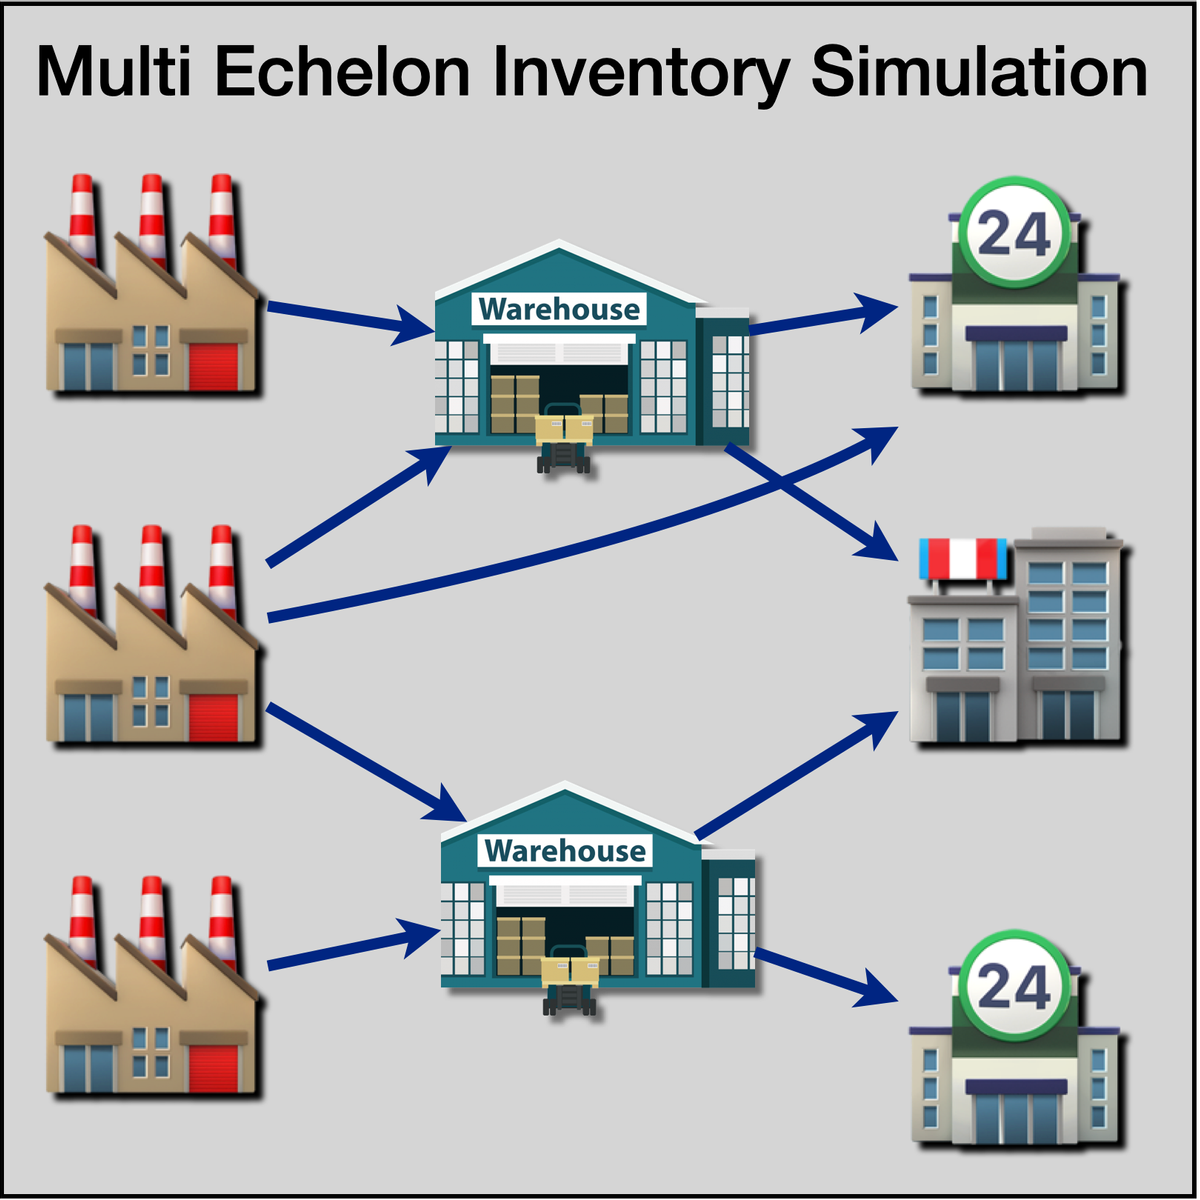
Multi-Echelon Inventory Simulation Using R Simmer
Welcome to "Multi Echelon Inventory Simulation Using R Simmer". This is a project-based course which should take about 2 hours to finish. Before diving into the project, please take a look at the course objectives and structure. By the end of this project, you will gain introductiory knowledge of Discrete Event Simulation, Multi Echelon Inventory Systems, be able to use R Studio and Simmer library, create statistical variables required for simulation, define process trajectory, define and assign resources, define arrivals (eg. incoming customers / work units), run simulation in R, store results in data frames, plot charts and interpret the results.
Cloud DNS: Traffic Steering using Geolocation Policy
This is a self-paced lab that takes place in the Google Cloud console.
In this lab you will configure and test the Geolocation routing policy.
Reproducible Templates for Analysis and Dissemination
This course will assist you with recreating work that a previous coworker completed, revisiting a project you abandoned some time ago, or simply reproducing a document with a consistent format and workflow. Incomplete information about how the work was done, where the files are, and which is the most recent version can give rise to many complications. This course focuses on the proper documentation creation process, allowing you and your colleagues to easily reproduce the components of your workflow. Throughout this course, you'll receive helpful demonstrations of RStudio and the R Markdown language and engage in active learning opportunities to help you build a professional online portfolio.
Datadog: Getting started with the Helm Chart
This is a self-paced lab that takes place in the Google Cloud console. In this lab, you will learn how to use the Datadog Helm Chart.
In this lab you will run the Datadog Agent in a Kubernetes cluster as a DaemonSet in order to start collecting your cluster and applications metrics, traces, and logs. You can deploy a Datadog Agent with a Helm chart or directly with a DaemonSet object YAML definition.
In this lab you will be explaining and using those options in a real cluster, checking in real time the features they enable.
Serverless Data Processing with Dataflow: Develop Pipelines
In this second installment of the Dataflow course series, we are going to be diving deeper on developing pipelines using the Beam SDK. We start with a review of Apache Beam concepts. Next, we discuss processing streaming data using windows, watermarks and triggers. We then cover options for sources and sinks in your pipelines, schemas to express your structured data, and how to do stateful transformations using State and Timer APIs. We move onto reviewing best practices that help maximize your pipeline performance. Towards the end of the course, we introduce SQL and Dataframes to represent your business logic in Beam and how to iteratively develop pipelines using Beam notebooks.
Explore insights from text analysis using Amazon Comprehend
In this one-hour project, you will understand how Amazon Comprehend works and how you can use the power of Natual Language Processing, NLP, and Machine Learning to extract information and explore insights from text. You will learn how to use Amazon Comprehend to extract entities, people, sentiments, and other elements from text like Tweets, understand how the results are organized, manipulate the data and generate a report to explore the insights.
Amazon Comprehend is a fully managed service and it is one of the most powerful Natural Language Processing engines in the market, so you can get up and running quickly, without having to train models from scratch.
Once you're done with this project, you will be able to use Amazon Comprehend to extract, analyze and explore insights in your documents in just a few steps.
Popular Internships and Jobs by Categories
Find Jobs & Internships
Browse


© 2024 BoostGrad | All rights reserved