Back to Courses


Data Science Courses - Page 88
Showing results 871-880 of 1407
How to Use SQL with Large Datasets
By the end of this project, you will use SQL to manage a large COVID-19 dataset using MySQL Workbench.
MySQL is a widely used relational database and can be used with large datasets if it is managed appropriately. This may include using the proper database engine, indexing the database, creating summary tables, and using proper database queries.
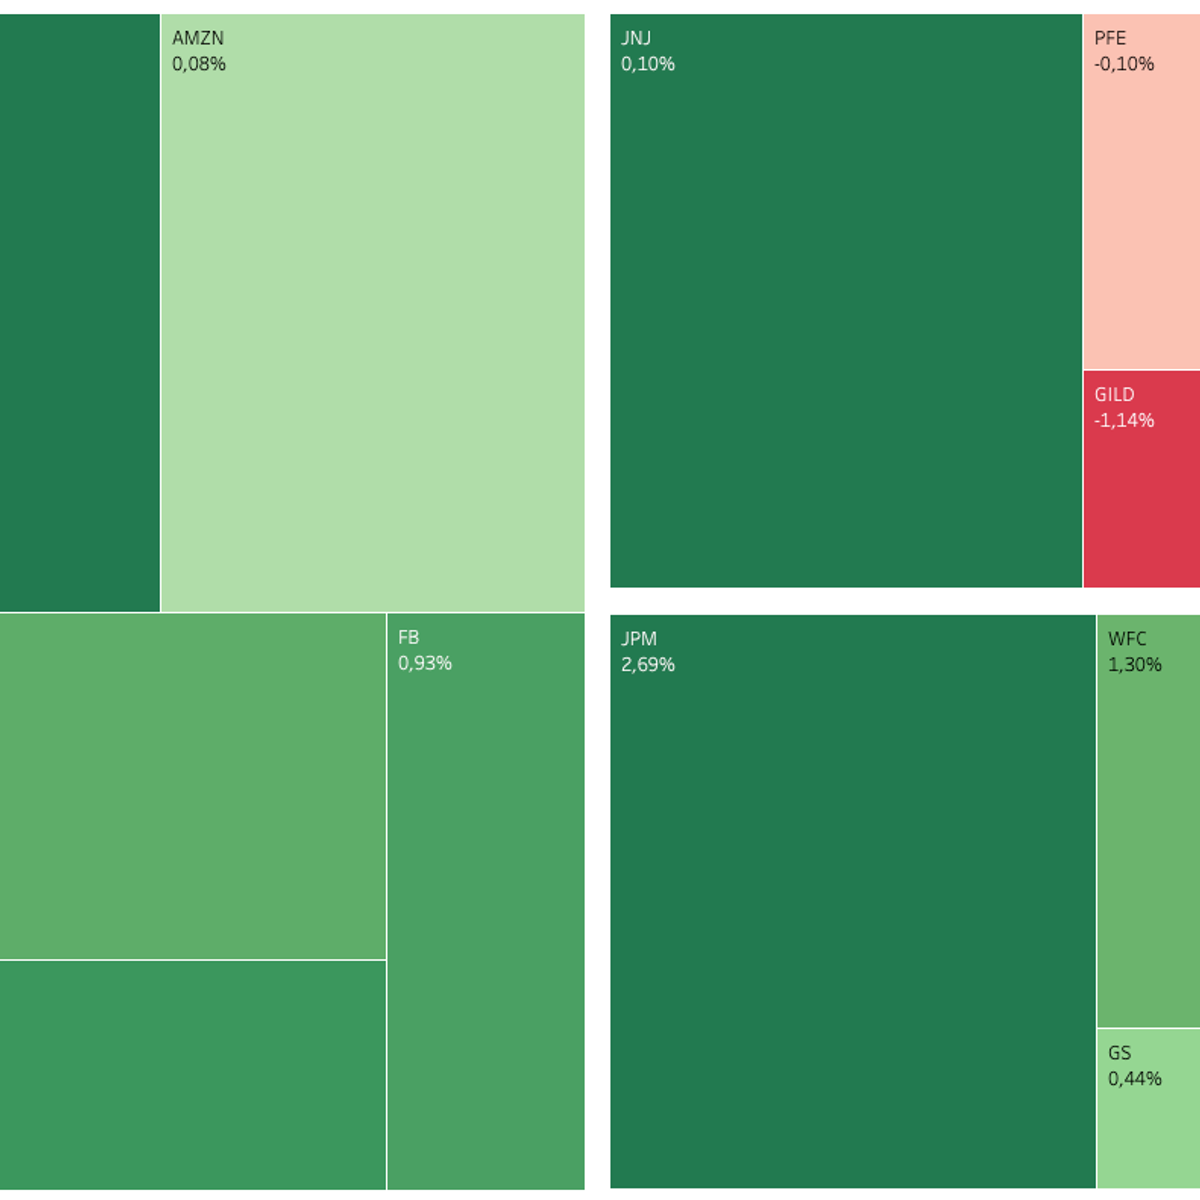
Building Stock Returns Heatmap with Tableau
In this 1-hour long project-based course, you will learn how to extract stock data using Google Finance, build a Heat and Treemap in Tableau, build a stock returns dashboard in Tableau.
Note: This course works best for learners who are based in the North America region. We're currently working on providing the same experience in other regions.
This course's content is not intended to be investment advice and does not constitute an offer to perform any operations in the regulated or unregulated financial market.
Descriptive and Inferential Statistics in R
In this 1-hour long project-based course, you will learn how to summarize descriptive statistics, calculate correlations and perform hypothesis testing in R
Note: This course works best for learners who are based in the North America region. We’re currently working on providing the same experience in other regions.
Introduction to R Programming and Tidyverse
This course is a gentle introduction to programming in R designed for 3 types of learners. It will be right for you, if:
• you want to do data analysis but don’t know programming
• you know programming but aren’t familiar with R
• you know some R programming but want to learn the tidyverse verbs
You will learn to do data visualization and analysis in a reproducible manner and use functions that allow your code to be easily read and understood. You will use RMarkdown to create nice documents and reports that execute your code freshly every time it’s run and that capture your thoughts about the data along the way.
This course has been designed for learners from non-STEM backgrounds to help prepare them for more advanced data science courses by providing an introduction to programming and to the R language. I am excited for you to join me on the journey!
The course logo was created using images of stickers from the RStudio shop. Please visit https://swag.rstudio.com/s/shop.
MySQL with Information Technology
In this project you will explore how MySQL fits into information systems. You will become familiar with MySQL features as you explore database management system options and participate in hands-on exercises using MySQL Workbench to create and populate a table in a MySQL relational database.
Note: This course works best for learners who are based in the North America region. We’re currently working on providing the same experience in other regions.
Introduction to Computer Vision and Image Processing
Computer Vision is one of the most exciting fields in Machine Learning and AI. It has applications in many industries, such as self-driving cars, robotics, augmented reality, and much more. In this beginner-friendly course, you will understand computer vision and learn about its various applications across many industries.
As part of this course, you will utilize Python, Pillow, and OpenCV for basic image processing and perform image classification and object detection.
This is a hands-on course and involves several labs and exercises. Labs will combine Jupyter Labs and Computer Vision Learning Studio (CV Studio), a free learning tool for computer vision. CV Studio allows you to upload, train, and test your own custom image classifier and detection models. At the end of the course, you will create your own computer vision web app and deploy it to the Cloud.
This course does not require any prior Machine Learning or Computer Vision experience. However, some knowledge of the Python programming language and high school math is necessary.
Sample-based Learning Methods
In this course, you will learn about several algorithms that can learn near optimal policies based on trial and error interaction with the environment---learning from the agent’s own experience. Learning from actual experience is striking because it requires no prior knowledge of the environment’s dynamics, yet can still attain optimal behavior. We will cover intuitively simple but powerful Monte Carlo methods, and temporal difference learning methods including Q-learning. We will wrap up this course investigating how we can get the best of both worlds: algorithms that can combine model-based planning (similar to dynamic programming) and temporal difference updates to radically accelerate learning.
By the end of this course you will be able to:
- Understand Temporal-Difference learning and Monte Carlo as two strategies for estimating value functions from sampled experience
- Understand the importance of exploration, when using sampled experience rather than dynamic programming sweeps within a model
- Understand the connections between Monte Carlo and Dynamic Programming and TD.
- Implement and apply the TD algorithm, for estimating value functions
- Implement and apply Expected Sarsa and Q-learning (two TD methods for control)
- Understand the difference between on-policy and off-policy control
- Understand planning with simulated experience (as opposed to classic planning strategies)
- Implement a model-based approach to RL, called Dyna, which uses simulated experience
- Conduct an empirical study to see the improvements in sample efficiency when using Dyna
Predict Career Longevity for NBA Rookies using Scikit-learn
By the end of this project, you will be able to apply data analysis to predict career longevity for NBA Rookie using python. Determining whether a player’s career will flourish or not became a science based on the player’s stats. Throughout the project, you will be able to analyze players’ stats and build your own binary classification model using Scikit-learn to predict if the NBA rookie will last for 5 years in the league if provided with some stats such as Games played, assists, steals and turnovers …. etc.
Note: This course works best for learners who are based in the North America region. We’re currently working on providing the same experience in other regions.
Two Major Models of running containers in AWS
Welcome to this Project about “Two Major Models of running Containers in AWS”. This Project will be focusing on one of the many types of computing in AWS, called “Container Computing”. To understand the benefits of AWS Products and services, which relates to Containers, you need to understand what ‘Containers’ are and what benefits ‘Container Computing’ Provides. In this Project, you are going to get a chance to make a ‘Container’.
If you are looking to deploy applications across multiple machines and platforms, Containers and virtual machines (VMs) are two of the top approaches in use today. Both can help your IT team become more agile and responsive to business demands. Both are used to host applications. Before containers came along, the “virtual machine” was the technology of choice for optimizing server capacity, but Virtual Machines had some drawbacks.
I f you run a virtual machine, say with 4 GB RAM and 4 GB disk, the operating system can easily consume 60 - 70% of the disk and much of the available memory, leaving relatively little for application which run in those Virtual Machine. But Containerization handles things in a different way. Instead of running a whole ‘operating System’ for each application, containers run as a process. So if you could run 5 applications using ‘Virtualization’, you will be able to run 15 applications using ‘Containerization’.
This Project will help you to learn different ways of running “containers” in AWS. There are two different ways to run “containers” in AWS. One is using “EC2 instance” and other using “ECS Fargate”.So this Project has two major parts. In the first part, you will learn to create a docker image and test that image by running on a container, and once you verified your docker image works, you are going to upload it to “DockerHub”, which is a popular online resource for uploading docker images for others to access, either public or specific private individuals.In the second part of this project, you will learn to create an ECS cluster with Fargate cluster mode, and will deploy the container we created, into Fargate Cluster. So you are going to get some practical experience of how to deploy real container into a Fargate Cluster.
There is a lot to get through though. so let’s get started!!
Note: This course works best for learners who are based in the North America region. We’re currently working on providing the same experience in other regions.
Share Data Through the Art of Visualization
This is the sixth course in the Google Data Analytics Certificate. These courses will equip you with the skills needed to apply to introductory-level data analyst jobs. You’ll learn how to visualize and present your data findings as you complete the data analysis process. This course will show you how data visualizations, such as visual dashboards, can help bring your data to life. You’ll also explore Tableau, a data visualization platform that will help you create effective visualizations for your presentations. Current Google data analysts will continue to instruct and provide you with hands-on ways to accomplish common data analyst tasks with the best tools and resources.
Learners who complete this certificate program will be equipped to apply for introductory-level jobs as data analysts. No previous experience is necessary.
By the end of this course, you will:
- Examine the importance of data visualization.
- Learn how to form a compelling narrative through data stories.
- Gain an understanding of how to use Tableau to create dashboards and dashboard filters.
- Discover how to use Tableau to create effective visualizations.
- Explore the principles and practices involved with effective presentations.
- Learn how to consider potential limitations associated with the data in your presentations.
- Understand how to apply best practices to a Q&A with your audience.
Popular Internships and Jobs by Categories
Find Jobs & Internships
Browse


© 2024 BoostGrad | All rights reserved