Back to Courses





Data Science Courses - Page 90
Showing results 891-900 of 1407

Econometrics: Methods and Applications
Welcome!
Do you wish to know how to analyze and solve business and economic questions with data analysis tools? Then Econometrics by Erasmus University Rotterdam is the right course for you, as you learn how to translate data into models to make forecasts and to support decision making.
* What do I learn?
When you know econometrics, you are able to translate data into models to make forecasts and to support decision making in a wide variety of fields, ranging from macroeconomics to finance and marketing. Our course starts with introductory lectures on simple and multiple regression, followed by topics of special interest to deal with model specification, endogenous variables, binary choice data, and time series data. You learn these key topics in econometrics by watching the videos with in-video quizzes and by making post-video training exercises.
* Do I need prior knowledge?
The course is suitable for (advanced undergraduate) students in economics, finance, business, engineering, and data analysis, as well as for those who work in these fields. The course requires some basics of matrices, probability, and statistics, which are reviewed in the Building Blocks module. If you are searching for a MOOC on econometrics of a more introductory nature that needs less background in mathematics, you may be interested in the Coursera course “Enjoyable Econometrics” that is also from Erasmus University Rotterdam.
* What literature can I consult to support my studies?
You can follow the MOOC without studying additional sources. Further reading of the discussed topics (including the Building Blocks) is provided in the textbook that we wrote and on which the MOOC is based: Econometric Methods with Applications in Business and Economics, Oxford University Press. The connection between the MOOC modules and the book chapters is shown in the Course Guide – Further Information – How can I continue my studies.
* Will there be teaching assistants active to guide me through the course?
Staff and PhD students of our Econometric Institute will provide guidance in January and February of each year. In other periods, we provide only elementary guidance. We always advise you to connect with fellow learners of this course to discuss topics and exercises.
* How will I get a certificate?
To gain the certificate of this course, you are asked to make six Test Exercises (one per module) and a Case Project. Further, you perform peer-reviewing activities of the work of three of your fellow learners of this MOOC. You gain the certificate if you pass all seven assignments.
Have a nice journey into the world of Econometrics!
The Econometrics team

Python and Statistics for Financial Analysis
Course Overview: https://youtu.be/JgFV5qzAYno
Python is now becoming the number 1 programming language for data science. Due to python’s simplicity and high readability, it is gaining its importance in the financial industry. The course combines both python coding and statistical concepts and applies into analyzing financial data, such as stock data.
By the end of the course, you can achieve the following using python:
- Import, pre-process, save and visualize financial data into pandas Dataframe
- Manipulate the existing financial data by generating new variables using multiple columns
- Recall and apply the important statistical concepts (random variable, frequency, distribution, population and sample, confidence interval, linear regression, etc. ) into financial contexts
- Build a trading model using multiple linear regression model
- Evaluate the performance of the trading model using different investment indicators
Jupyter Notebook environment is configured in the course platform for practicing python coding without installing any client applications.

Data for Machine Learning
This course is all about data and how it is critical to the success of your applied machine learning model. Completing this course will give learners the skills to:
Understand the critical elements of data in the learning, training and operation phases
Understand biases and sources of data
Implement techniques to improve the generality of your model
Explain the consequences of overfitting and identify mitigation measures
Implement appropriate test and validation measures.
Demonstrate how the accuracy of your model can be improved with thoughtful feature engineering.
Explore the impact of the algorithm parameters on model strength
To be successful in this course, you should have at least beginner-level background in Python programming (e.g., be able to read and code trace existing code, be comfortable with conditionals, loops, variables, lists, dictionaries and arrays). You should have a basic understanding of linear algebra (vector notation) and statistics (probability distributions and mean/median/mode).
This is the third course of the Applied Machine Learning Specialization brought to you by Coursera and the Alberta Machine Intelligence Institute.

Scalable Machine Learning on Big Data using Apache Spark
This course will empower you with the skills to scale data science and machine learning (ML) tasks on Big Data sets using Apache Spark. Most real world machine learning work involves very large data sets that go beyond the CPU, memory and storage limitations of a single computer.
Apache Spark is an open source framework that leverages cluster computing and distributed storage to process extremely large data sets in an efficient and cost effective manner. Therefore an applied knowledge of working with Apache Spark is a great asset and potential differentiator for a Machine Learning engineer.
After completing this course, you will be able to:
- gain a practical understanding of Apache Spark, and apply it to solve machine learning problems involving both small and big data
- understand how parallel code is written, capable of running on thousands of CPUs.
- make use of large scale compute clusters to apply machine learning algorithms on Petabytes of data using Apache SparkML Pipelines.
- eliminate out-of-memory errors generated by traditional machine learning frameworks when data doesn’t fit in a computer's main memory
- test thousands of different ML models in parallel to find the best performing one – a technique used by many successful Kagglers
- (Optional) run SQL statements on very large data sets using Apache SparkSQL and the Apache Spark DataFrame API.
Enrol now to learn the machine learning techniques for working with Big Data that have been successfully applied by companies like Alibaba, Apple, Amazon, Baidu, eBay, IBM, NASA, Samsung, SAP, TripAdvisor, Yahoo!, Zalando and many others.
NOTE: You will practice running machine learning tasks hands-on on an Apache Spark cluster provided by IBM at no charge during the course which you can continue to use afterwards.
Prerequisites:
- basic python programming
- basic machine learning (optional introduction videos are provided in this course as well)
- basic SQL skills for optional content
The following courses are recommended before taking this class (unless you already have the skills)
https://www.coursera.org/learn/python-for-applied-data-science or similar
https://www.coursera.org/learn/machine-learning-with-python or similar
https://www.coursera.org/learn/sql-data-science for optional lectures

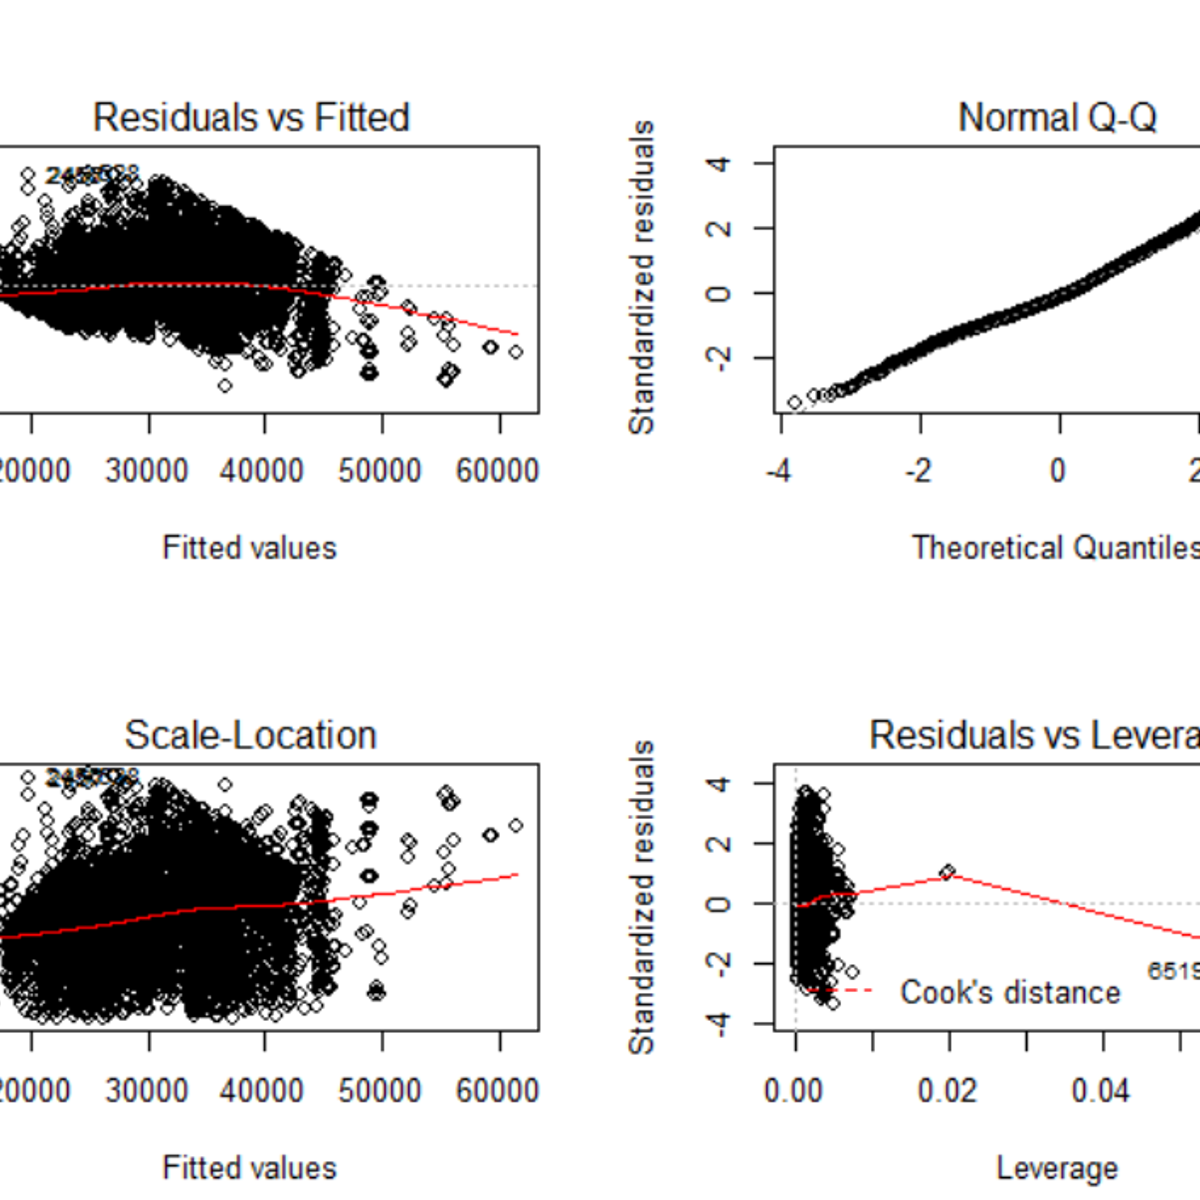
Building and analyzing linear regression model in R
By the end of this project, you will learn how to build and analyse linear regression model in R, a free, open-source program that you can download. You will learn how to load and clean a real world dataset. Next, you will learn how to build a linear regression model and various plots to analyze the model’s performance. Lastly, you will learn how to predict future values using the model. By the end of this project, you will become confident in building a linear regression model on real world dataset and the know-how of assessing the model’s performance using R programming language.
Linear regression models are useful in identifying critical relationships between predictors (or factors) and output variable. These relationships can impact a business in the future and can help business owners to make decisions.
Note: This course works best for learners who are based in the North America region. We’re currently working on providing the same experience in other regions.

Calculating Descriptive Statistics in R
Welcome to this 2-hour long project-based course Calculating Descriptive Statistics in R. In this project, you will learn how to perform extensive descriptive statistics on both quantitative and qualitative variables in R. You will also learn how to calculate the frequency and percentage of categorical variables and check the distribution of quantitative variables. By extension, you will learn how to perform univariate and bivariate statistics for univariate and bivariate variables in R.
Note: You do not need to be a Data Scientist to be successful in this guided project, just a familiarity with basic statistics and using R suffice for this project. If you are not familiar with R and want to learn the basics, start with my previous guided project titled “Getting Started with R”.

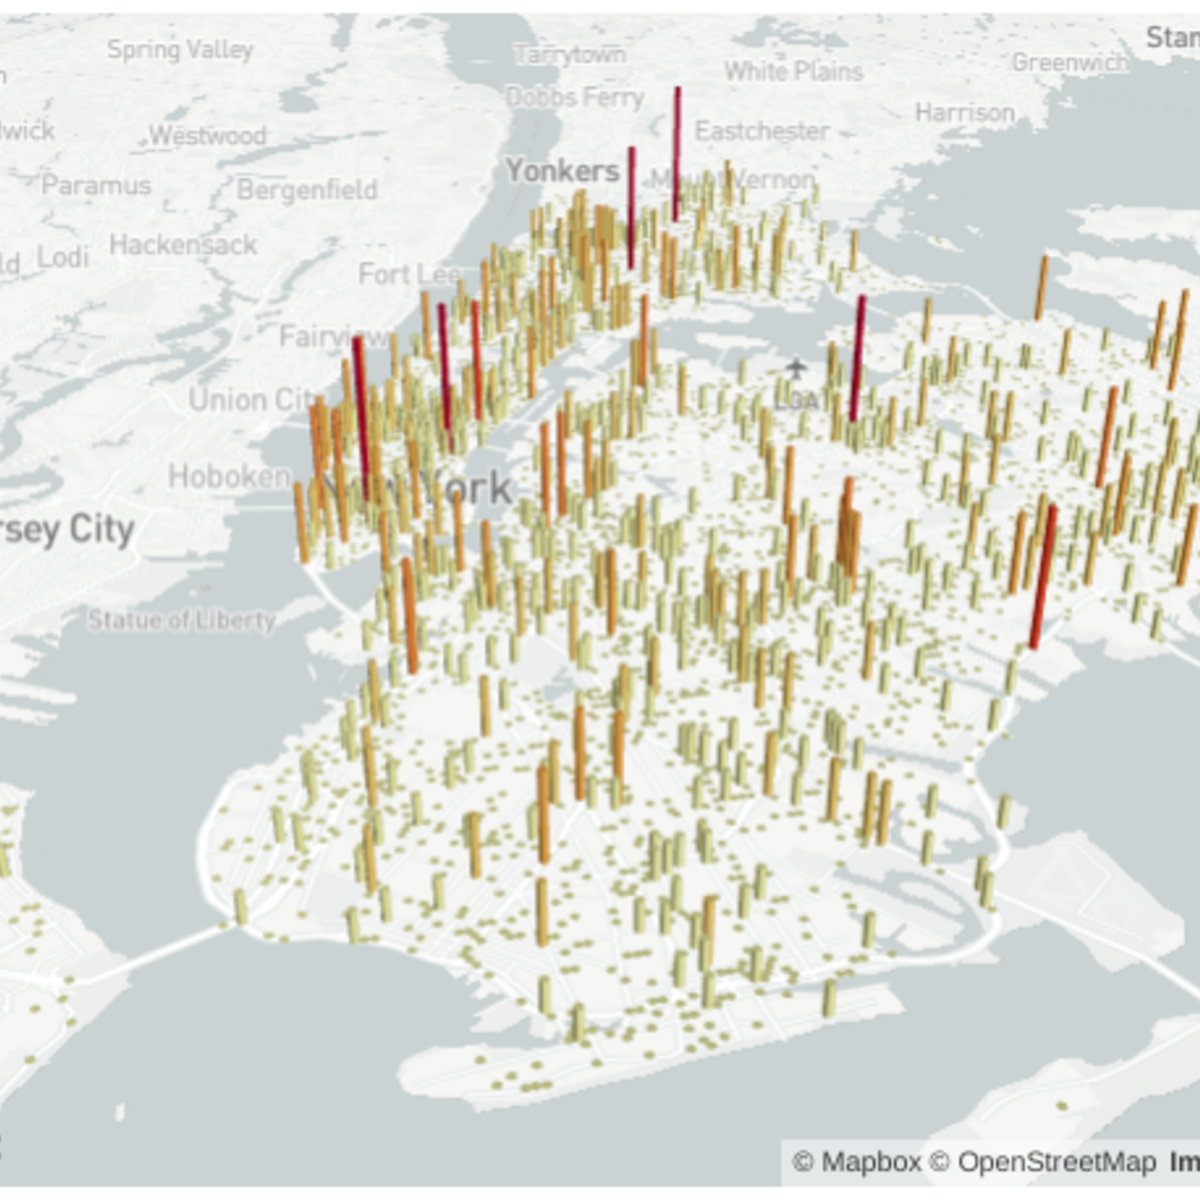
Build a Data Science Web App with Streamlit and Python
Welcome to this hands-on project on building your first data science web app with the Streamlit library in Python. By the end of this project, you are going to be comfortable with using Python and Streamlit to build beautiful and interactive web apps with zero web development experience! We are going to load, explore, visualize and interact with data, and generate dashboards in less than 100 lines of Python code!
Prior experience with writing simple Python scripts and using pandas for data manipulation is recommended.
Note: This course works best for learners who are based in the North America region. We’re currently working on providing the same experience in other regions.
Communicate Effectively about Ethical Challenges in Data-Driven Technologies
Leading a data-driven organization necessitates effective communication to create a culture of ethical practice. Communication to stakeholders will guide an organization's strategy and potentially impact the future of work for that organization or entity. It is not enough to talk about ethical practices, you need to to relate their value to stakeholders. Building out strategies that are inclusive and relatable can build public trust and loyalty, and knowing how to plan for a crisis will reduce the harm to such trust and loyalty.
In this fourth course of the CertNexus Certified Ethical Emerging Technologist (CEET) professional certificate, learners will develop inclusive strategies to communicate business impacts to stakeholders, design communication strategies that mirror ethical principles and policies, and in case of an ethical crisis, be prepared to manage the crisis and the media to reduce business impact.
This course is the fourth of five courses within the Certified Ethical Emerging Technologist (CEET) professional certificate. The preceding courses are titled Promote the Ethical Use of Data-Driven Technologies, Turn Ethical Frameworks into Actionable Steps, and Detect and Mitigate Ethical Risks.

Prepare, Clean, Transform, and Load Data using Power BI
Usually, tidy data is a mirage in a real-world setting. Additionally, before quality analysis can be done, data need to be in a proper format. This project-based course, "Prepare, Clean, Transform, and Load Data using Power BI" is for beginner and intermediate Power BI users willing to advance their knowledge and skills.
In this course, you will learn practical ways for data cleaning and transformation using Power BI. We will talk about different data cleaning and transformation tasks like splitting, renaming, adding, removing columns. By the end of this 2-hour-long project, you will change data types, merge and append data sets. By extension, you will learn how to import data from the web and unpivot data.
This project-based course is a beginner to an intermediate-level course in Power BI. Therefore, to get the most of this project, it is essential to have a basic understanding of using a computer before you take this project.

Applied Social Network Analysis in Python
This course will introduce the learner to network analysis through tutorials using the NetworkX library. The course begins with an understanding of what network analysis is and motivations for why we might model phenomena as networks. The second week introduces the concept of connectivity and network robustness. The third week will explore ways of measuring the importance or centrality of a node in a network. The final week will explore the evolution of networks over time and cover models of network generation and the link prediction problem.
This course should be taken after: Introduction to Data Science in Python, Applied Plotting, Charting & Data Representation in Python, and Applied Machine Learning in Python.
Popular Internships and Jobs by Categories
Find Jobs & Internships
Browse
© 2024 BoostGrad | All rights reserved