Back to Courses


Data Science Courses - Page 85
Showing results 841-850 of 1407
Excel Basics for Data Analysis
This course is designed to provide you with basic working knowledge for using Excel spreadsheets for Data Analysis. It covers some of the first steps for working with spreadsheets and their usage in the process of analyzing data. It includes plenty of videos, demos, and examples for you to learn, followed by step-by-step instructions for you to apply and practice on a live spreadsheet.
Excel is an essential tool for working with data - whether for business, marketing, data analytics, or research. This course is suitable for those aspiring to take up Data Analysis or Data Science as a profession, as well as those who just want to use Excel for data analysis in their own domains. You will gain valuable experience in cleansing and wrangling data using functions and then analyze your data using techniques like filtering, sorting and creating pivot tables.
This course starts with an introduction to spreadsheets like Microsoft Excel and Google Sheets and loading data from multiple formats. With this introduction you will then learn to perform some basic level data wrangling and cleansing tasks and continue to expand your knowledge of analyzing data through the use of filtering, sorting, and using pivot tables within the spreadsheet. By performing these tasks throughout the course, it will give you an understanding of how spreadsheets can be used as a data analysis tool and understand its limitations.
There is a strong focus on practice and applied learning in this course. With each lab, you will gain hands-on experience in manipulating data and begin to understand the important role of spreadsheets. Clean and analyze your data faster by understanding functions in the formatting of data. You will then convert your data to a pivot table and learn its features to make your data organized and readable. The final project enables you to show off your newly acquired data analysis skills. By the end of this course you will have worked with several data sets and spreadsheets and demonstrated the basics of cleaning and analyzing data all without having to learn any code.
Getting started with Excel is made easy in this course. It does not require any prior experience with spreadsheets or coding. Nor does it require downloads or installation of any software. All you need is a device with a modern web browser, and ability to create a Microsoft account to access Excel online at no-cost. However if you already have a desktop version of Excel, you can follow along quite easily as well.
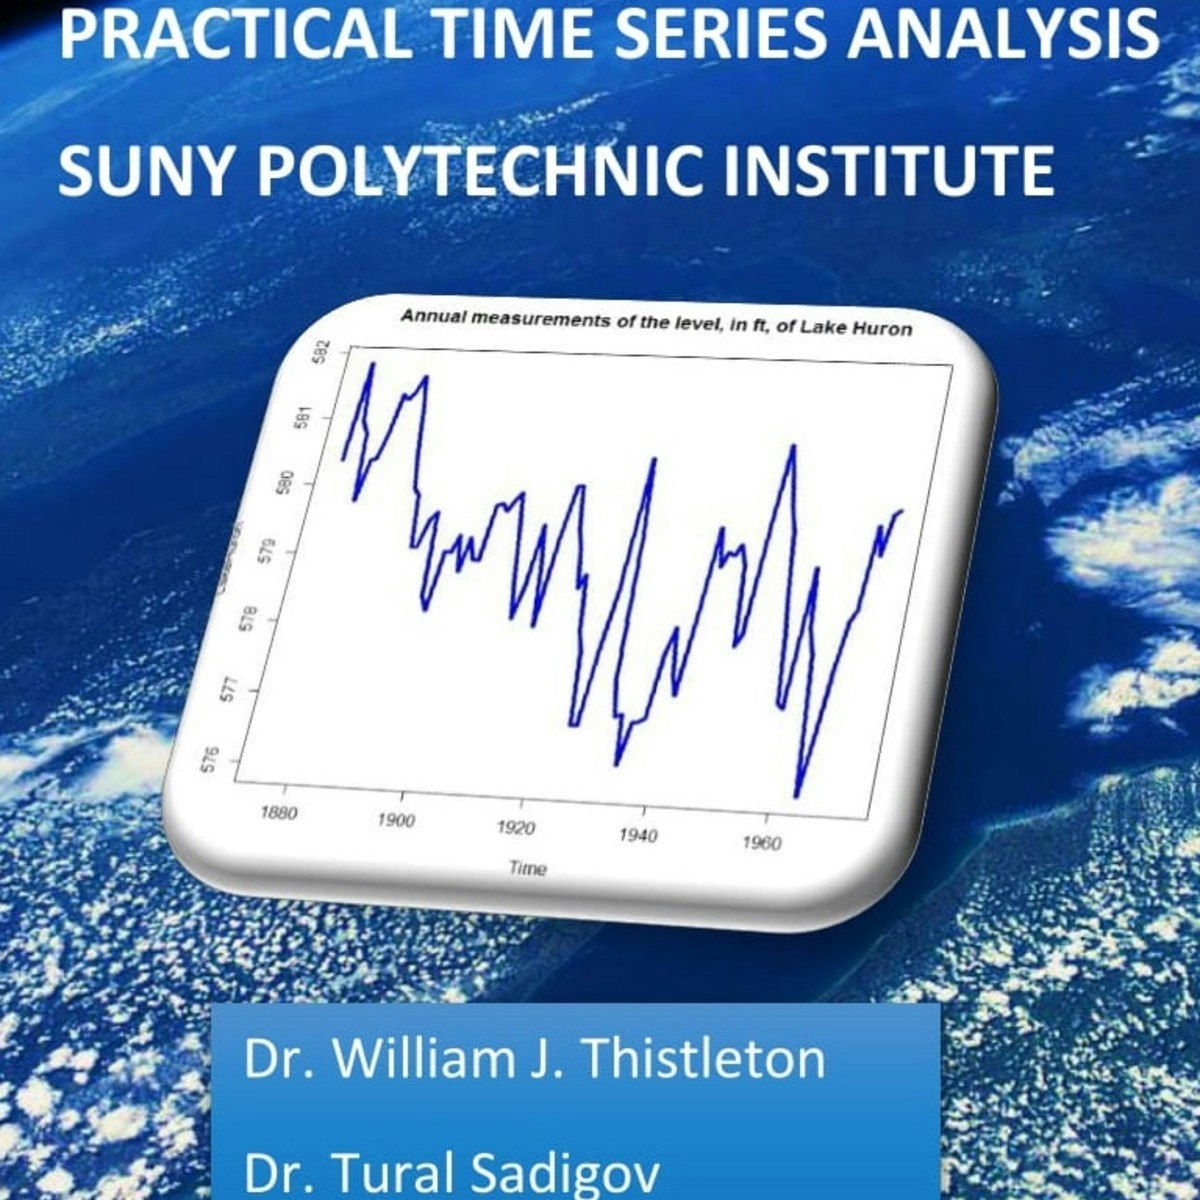
Practical Time Series Analysis
Welcome to Practical Time Series Analysis!
Many of us are "accidental" data analysts. We trained in the sciences, business, or engineering and then found ourselves confronted with data for which we have no formal analytic training. This course is designed for people with some technical competencies who would like more than a "cookbook" approach, but who still need to concentrate on the routine sorts of presentation and analysis that deepen the understanding of our professional topics.
In practical Time Series Analysis we look at data sets that represent sequential information, such as stock prices, annual rainfall, sunspot activity, the price of agricultural products, and more. We look at several mathematical models that might be used to describe the processes which generate these types of data. We also look at graphical representations that provide insights into our data. Finally, we also learn how to make forecasts that say intelligent things about what we might expect in the future.
Please take a few minutes to explore the course site. You will find video lectures with supporting written materials as well as quizzes to help emphasize important points. The language for the course is R, a free implementation of the S language. It is a professional environment and fairly easy to learn.
You can discuss material from the course with your fellow learners. Please take a moment to introduce yourself!
Time Series Analysis can take effort to learn- we have tried to present those ideas that are "mission critical" in a way where you understand enough of the math to fell satisfied while also being immediately productive. We hope you enjoy the class!
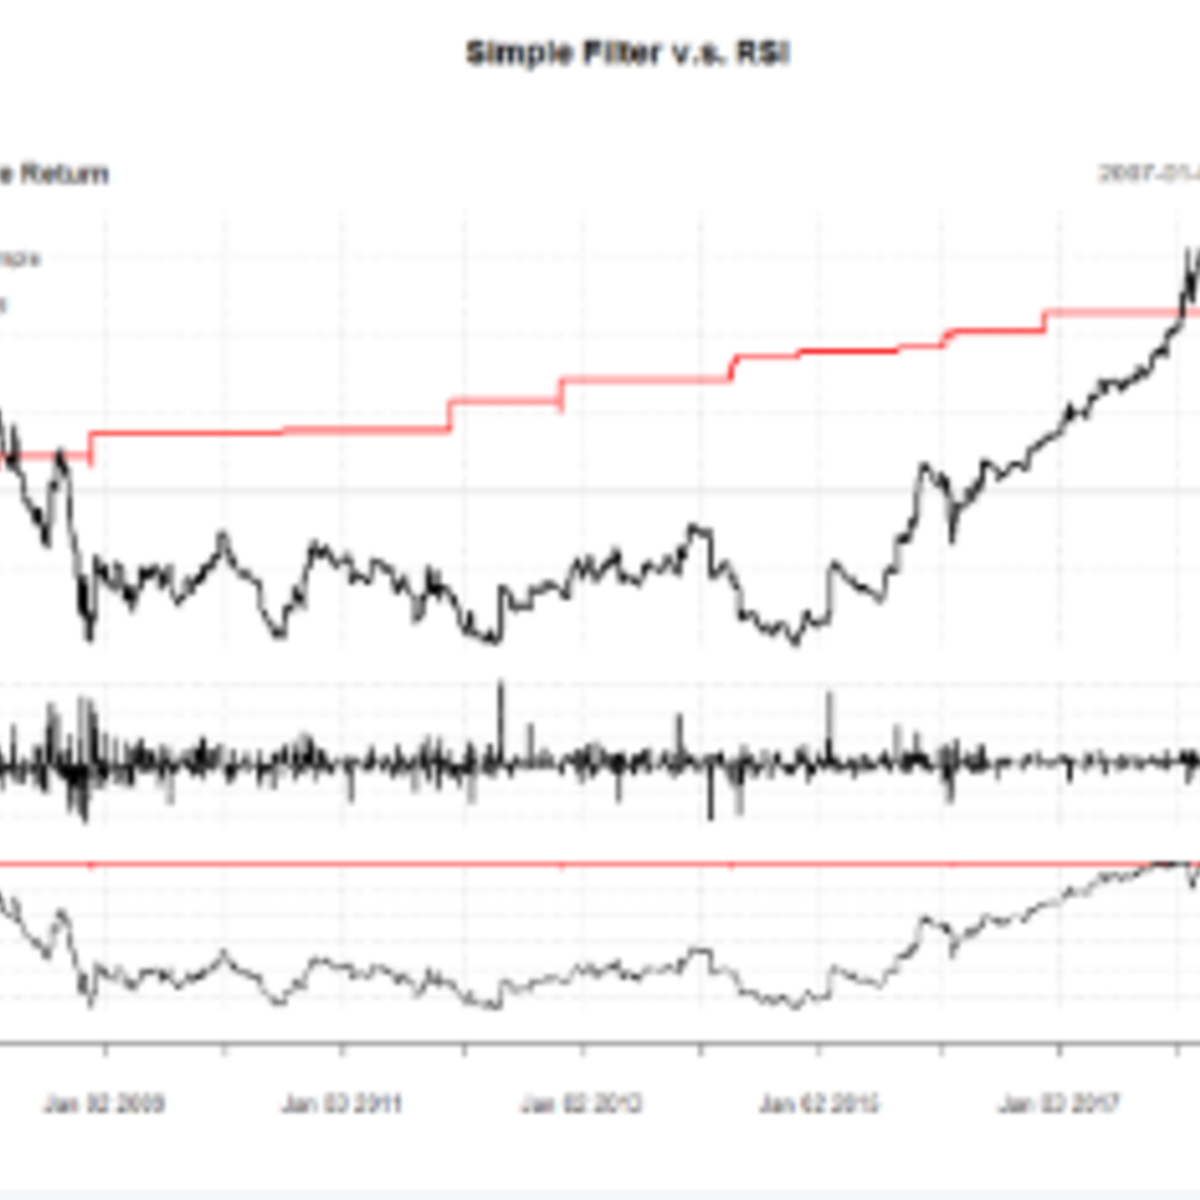
Create a Buy Signal using RSI in R with the Quantmod Package
In this 1-hour long project-based course, you will learn how to pull down Stock Data using the R quantmod package. You will also learn how to perform analytics and pass financial risk functions to the data.
Note: This course works best for learners who are based in the North America region. We’re currently working on providing the same experience in other regions.
Performing Confirmatory Data Analysis in R
Welcome to this project-based course Performing Confirmatory Data Analysis in R. In this project, you will learn how to perform extensive confirmatory data analysis, which is similar to performing inferential statistics in R.
By the end of this 2-hour long project, you will understand how to perform chi-square tests, which includes, the goodness of fit test, test for independence, and test for homogeneity. Also, you will learn how to calculate correlation for numeric variables and perform regression analysis. Also, you will learn how to interpret the results of a test and make viable decisions. By extension, you will learn how to explore some built-in R datasets to perform the different tests.
Note, you do not need to be a data scientist or statistical analyst to be successful in this guided project, just a familiarity with basic statistics and performing hypothesis test in R suffice for this project. A fundamental prerequisite is having a good understanding of the theory of hypothesis test. So, I recommend that you should take the Hypothesis Testing in R project before taking this project.
Database Creation and Modeling using MYSQL Workbench
In this 1-hour long project-based course, you will be able to identify and fully comprehend the basics of the MYSQL workbench and create a new connection to the local server. you will also learn how to create a new database and drop it, create new tables, and delete them. Moreover, You will be able to rename columns of a table, connect tables with each other, and add data to tables. And finally, you will learn how to add columns and apply some features professionally on these columns using some keywords such as PRIMARY KEY, FOREIGN KEY, NOT NULL, AUTO_INCREMENT, and DISTINCT and update the tables with new data. SQL is used by all the big names in tech like Netflix or Airbnb. If you target Google, Facebook, or Amazon, they, of course, have their database systems. But SQL will be there too to query and analyze the data.
This guided project is for beginners in the field of data management data modeling and databases. It provides you with the basics of creating the whole database. It equips you with knowledge of the first steps in modeling.
Note: This course works best for learners who are based in the North America region. We’re currently working on providing the same experience in other regions.
Climate Geospatial Analysis on Python with Xarray
By the end of this project, you will be able to load, visualize, manipulate and perform both simple and grouped operations over geospatial multidimensional data through Xarray and Python.
We'll explore an dataset containing temperature, vegetation density and total precipitation over the Brazilian Amazon for the 1979-2019 period while the concepts are developed.
This will enable the learner to handle and extract knowledge from complex datasets such as the ones from satellite and climate re-analysis observations.
Note: This course works best for learners who are based in the North America region. We’re currently working on providing the same experience in other regions.
Combining and Analyzing Complex Data
In this course you will learn how to use survey weights to estimate descriptive statistics, like means and totals, and more complicated quantities like model parameters for linear and logistic regressions. Software capabilities will be covered with R® receiving particular emphasis. The course will also cover the basics of record linkage and statistical matching—both of which are becoming more important as ways of combining data from different sources. Combining of datasets raises ethical issues which the course reviews. Informed consent may have to be obtained from persons to allow their data to be linked. You will learn about differences in the legal requirements in different countries.
Deep Learning Applications for Computer Vision
This course can be taken for academic credit as part of CU Boulder’s Master of Science in Data Science (MS-DS) degree offered on the Coursera platform. The MS-DS is an interdisciplinary degree that brings together faculty from CU Boulder’s departments of Applied Mathematics, Computer Science, Information Science, and others. With performance-based admissions and no application process, the MS-DS is ideal for individuals with a broad range of undergraduate education and/or professional experience in computer science, information science, mathematics, and statistics. Learn more about the MS-DS program at https://www.coursera.org/degrees/master-of-science-data-science-boulder.
In this course, you’ll be learning about Computer Vision as a field of study and research. First we’ll be exploring several Computer Vision tasks and suggested approaches, from the classic Computer Vision perspective. Then we’ll introduce Deep Learning methods and apply them to some of the same problems. We will analyze the results and discuss advantages and drawbacks of both types of methods. We'll use tutorials to let you explore hands-on some of the modern machine learning tools and software libraries. Examples of Computer Vision tasks where Deep Learning can be applied include: image classification, image classification with localization, object detection, object segmentation, facial recognition, and activity or pose estimation.
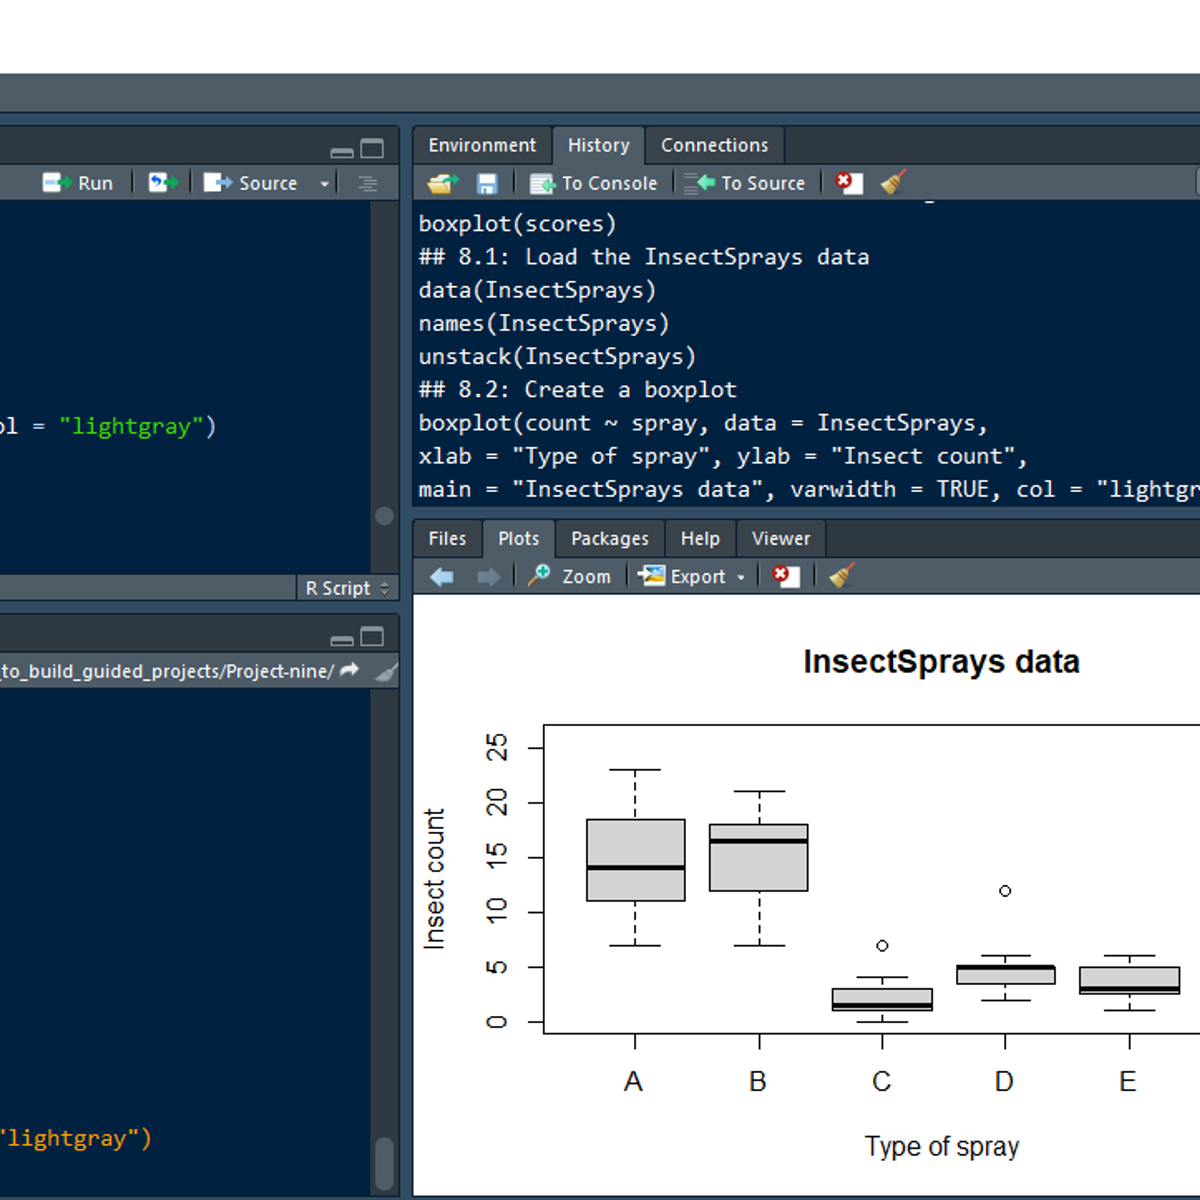
Data Analysis with R Programming
This course is the seventh course in the Google Data Analytics Certificate. These courses will equip you with the skills needed to apply to introductory-level data analyst jobs. In this course, you’ll learn about the programming language known as R. You’ll find out how to use RStudio, the environment that allows you to work with R. This course will also cover the software applications and tools that are unique to R, such as R packages. You’ll discover how R lets you clean, organize, analyze, visualize, and report data in new and more powerful ways. Current Google data analysts will continue to instruct and provide you with hands-on ways to accomplish common data analyst tasks with the best tools and resources.
Learners who complete this certificate program will be equipped to apply for introductory-level jobs as data analysts. No previous experience is necessary.
By the end of this course, you will:
- Examine the benefits of using the R programming language.
- Discover how to use RStudio to apply R to your analysis.
- Explore the fundamental concepts associated with programming in R.
- Explore the contents and components of R packages including the Tidyverse package.
- Gain an understanding of dataframes and their use in R.
- Discover the options for generating visualizations in R.
- Learn about R Markdown for documenting R programming.
Doing more with Google Sheets
Google Sheets is a robust, cloud-based application that empowers you to create sophisticated spreadsheets. Whether you are working at your desk—or from your smartphone or tablet on-the-go—Google Sheets helps you organize, analyze, and share your most important data. In this course for Sheets users, you’ll learn how to make your own supercharged spreadsheets, incorporating powerful functions and visualizations to accelerate your data analysis and share meaningful insights with your team. Follow along with exercises and a companion spreadsheet to practice new skills as you encounter them.
About the Instructor
Malia is a tech professional based in Los Angeles who uses Google Workspace and Google Sheets everyday to manage projects, collaborate with remote teams, and make data-driven decisions.
Popular Internships and Jobs by Categories
Find Jobs & Internships
Browse


© 2024 BoostGrad | All rights reserved