Back to Courses






Data Science Courses - Page 5
Showing results 41-50 of 1407

Generalized Linear Models and Nonparametric Regression
In the final course of the statistical modeling for data science program, learners will study a broad set of more advanced statistical modeling tools. Such tools will include generalized linear models (GLMs), which will provide an introduction to classification (through logistic regression); nonparametric modeling, including kernel estimators, smoothing splines; and semi-parametric generalized additive models (GAMs). Emphasis will be placed on a firm conceptual understanding of these tools. Attention will also be given to ethical issues raised by using complicated statistical models.
This course can be taken for academic credit as part of CU Boulder’s Master of Science in Data Science (MS-DS) degree offered on the Coursera platform. The MS-DS is an interdisciplinary degree that brings together faculty from CU Boulder’s departments of Applied Mathematics, Computer Science, Information Science, and others. With performance-based admissions and no application process, the MS-DS is ideal for individuals with a broad range of undergraduate education and/or professional experience in computer science, information science, mathematics, and statistics. Learn more about the MS-DS program at https://www.coursera.org/degrees/master-of-science-data-science-boulder.
Logo adapted from photo by Vincent Ledvina on Unsplash

SQL CASE Statements
Welcome to this project-based course, SQL CASE Statements. In this project, you will learn how to use SQL CASE statements to query tables in a database.
By the end of this 2-hour long project, you will be able to write simple CASE statements to retrieve the desired result from a database. Then, we will move systematically to write more complex SQL CASE statements. Furthermore, we will see how to use the CASE clause together with aggregate functions, and SQL joins to get the desired result you want from tables in a database. Also, you will learn how to use the CASE clause to transpose the result of a query.
Also, for this hands-on project, we will use PostgreSQL as our preferred database management system (DBMS). Therefore, to complete this project, it is required that you have prior experience with using PostgreSQL. Similarly, this project is an advanced SQL concept; so, a good foundation for writing SQL queries, and performing joins in SQL is vital to complete this project.
If you are not familiar with writing queries in SQL and SQL joins and want to learn these concepts, start with my previous guided projects titled “Querying Databases using SQL SELECT statement", “Performing Data Aggregation using SQL Aggregate Functions” and “Mastering SQL Joins”. I taught these guided projects using PostgreSQL. So, taking these projects will give the needed requisite to complete this project on SQL CASE Statements. However, if you are comfortable writing queries in PostgreSQL, please join me on this wonderful ride! Let’s get our hands dirty!

Developing Data Models with LookML
This course empowers you to develop scalable, performant LookML (Looker Modeling Language) models that provide your business users with the standardized, ready-to-use data that they need to answer their questions. Upon completing this course, you will be able to start building and maintaining LookML models to curate and manage data in your organization’s Looker instance.

Perform basic data analysis tasks using Java streams
In this 1-hour long project-based course, you will learn how to create a Java Stream object based on an array of data, and understand the distinction between terminal and intermediate stream operations. You will iterate through the data stream using the forEach method, and use a range of Stream methods to perform logical operations on the data stream. You will perform basic statistical calculations on a stream of numeric data, and string operations on a stream of string data. You will learn how to use the map, filter, and reduce Stream methods. Finally, you will learn how to load a CSV file, the COVID vaccination dataset, and turn it into a data stream, and perform basic exploratory analysis of the data.
Note: This course works best for learners who are based in the North America region. We’re currently working on providing the same experience in other regions.

Introduction to Clinical Data Science
This course will prepare you to complete all parts of the Clinical Data Science Specialization. In this course you will learn how clinical data are generated, the format of these data, and the ethical and legal restrictions on these data. You will also learn enough SQL and R programming skills to be able to complete the entire Specialization - even if you are a beginner programmer. While you are taking this course you will have access to an actual clinical data set and a free, online computational environment for data science hosted by our Industry Partner Google Cloud.
At the end of this course you will be prepared to embark on your clinical data science education journey, learning how to take data created by the healthcare system and improve the health of tomorrow's patients.

Demand Analytics
Welcome to Demand Analytics - one of the most sought-after skills in supply chain management and marketing!
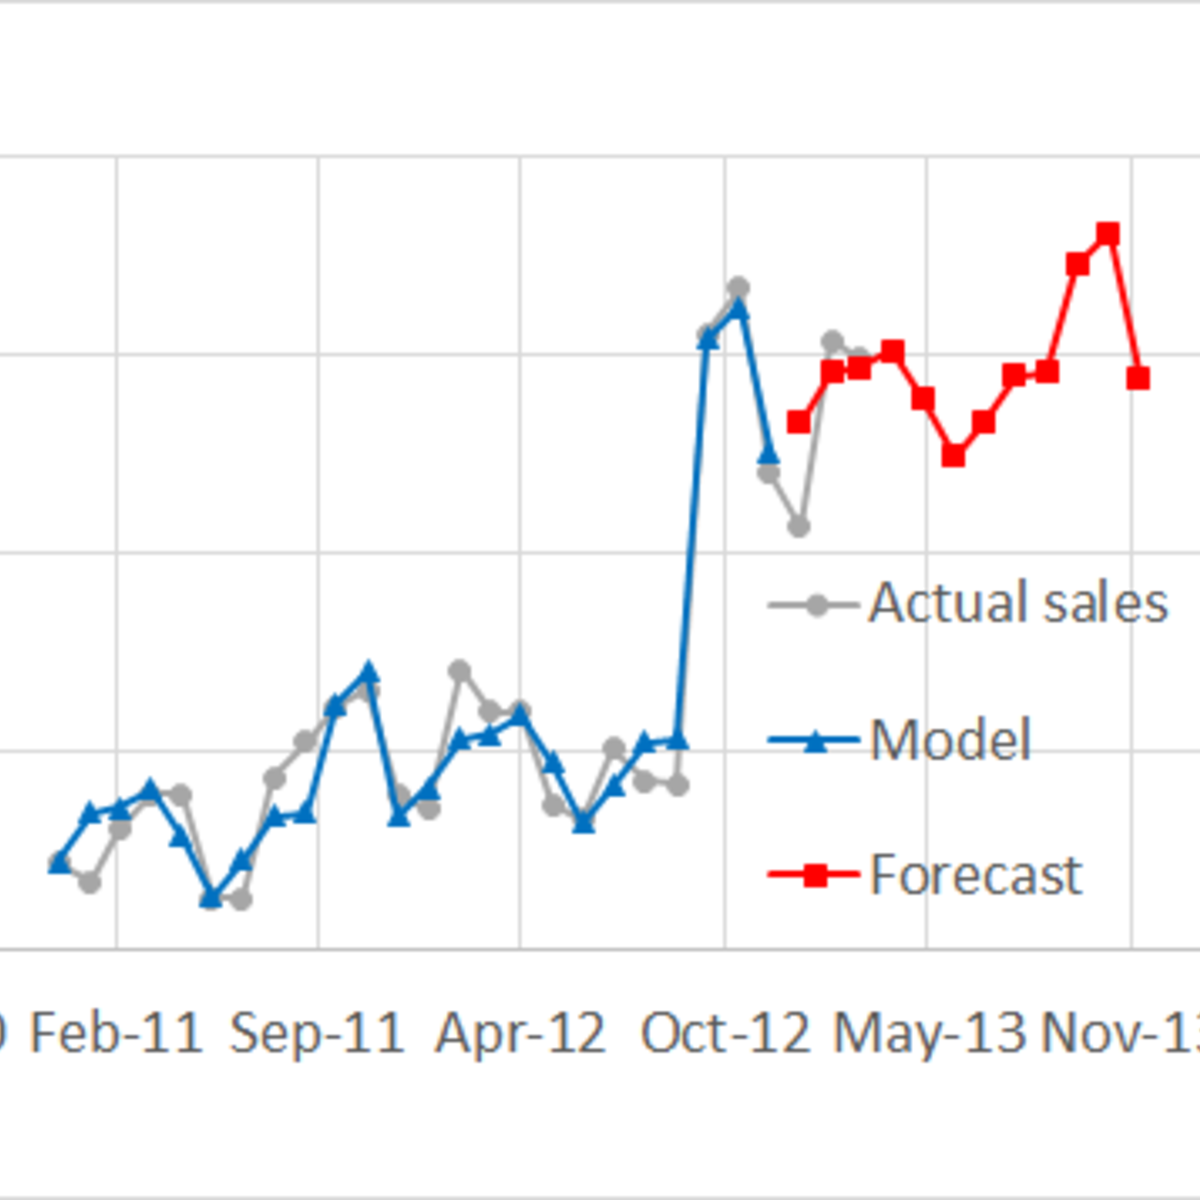
Through the real-life story and data of a leading cookware manufacturer in North America, you will learn the data analytics skills for demand planning and forecasting. Upon the completion of this course, you will be able to
1. Improve the forecasting accuracy by building and validating demand prediction models.
2. Better stimulate and influence demand by identifying the drivers (e.g., time, seasonality, price, and other environmental factors) for demand and quantifying their impact.
AK is a leading cookware manufacturer in North America. Its newly launched top-line product was gaining momentum in the marketplace. However, a price adjustment at the peak season stimulated a significant demand surge which took AK completely by surprise and resulted in huge backorders. AK faced the risk of losing the market momentum due to the upset customers and the high cost associated with over-time production and expedited shipping. Accurate demand forecast is essential for increasing revenue and reducing cost. Identifying the drivers for demand and assessing their impact on demand can help companies better influence and stimulate demand.
I hope you enjoy the course!

Information Visualization: Advanced Techniques
This course aims to introduce learners to advanced visualization techniques beyond the basic charts covered in Information Visualization: Fundamentals. These techniques are organized around data types to cover advance methods for: temporal and spatial data, networks and trees and textual data. In this module we also teach learners how to develop innovative techniques in D3.js.
Learning Goals
Goal: Analyze the design space of visualization solutions for various kinds of data visualization problems. Learn what designs are available for a given problem and what are their respective advantages and disadvantages.
- Temporal
- Spatial
- Spatio-Temporal
- Networks
- Trees
- Text
This is the fourth course in the Information Visualization Specialization. The course expects you to have some basic knowledge of programming as well as some basic visualization skills (as those introduced in the first course of the specialization).

Introduction to Data Engineering
This course introduces you to the core concepts, processes, and tools you need to know in order to get a foundational knowledge of data engineering. You will gain an understanding of the modern data ecosystem and the role Data Engineers, Data Scientists, and Data Analysts play in this ecosystem.
The Data Engineering Ecosystem includes several different components. It includes disparate data types, formats, and sources of data. Data Pipelines gather data from multiple sources, transform it into analytics-ready data, and make it available to data consumers for analytics and decision-making. Data repositories, such as relational and non-relational databases, data warehouses, data marts, data lakes, and big data stores process and store this data. Data Integration Platforms combine disparate data into a unified view for the data consumers. You will learn about each of these components in this course. You will also learn about Big Data and the use of some of the Big Data processing tools.
A typical Data Engineering lifecycle includes architecting data platforms, designing data stores, and gathering, importing, wrangling, querying, and analyzing data. It also includes performance monitoring and finetuning to ensure systems are performing at optimal levels. In this course, you will learn about the data engineering lifecycle. You will also learn about security, governance, and compliance.
Data Engineering is recognized as one of the fastest-growing fields today. The career opportunities available in the field and the different paths you can take to enter this field are discussed in the course.
The course also includes hands-on labs that guide you to create your IBM Cloud Lite account, provision a database instance, load data into the database instance, and perform some basic querying operations that help you understand your dataset.

Introduction to D3.js
This Guided Project, Introduction to D3.js is for those who want to learn about D3.js which is a JavaScript library for producing SVG-based, dynamic, interactive data visualizations in web browsers. In this 2-hour-long project-based course, you will get to know different SVG elements, build SVG-based webpages using D3.js, Integrate data into the SVG elements, and build simple data visualizations using D3.js. This project is unique because you will learn to build simple SVG-based data representations from scratch using D3.js. You will also learn how to integrate JSON data into your D3 data visualization. To be successful in this project, you will need to have knowledge of HTML, CSS, and Javascript programming language and to be experienced working with Visual Studio Code IDE.

Python Data Visualization
This if the final course in the specialization which builds upon the knowledge learned in Python Programming Essentials, Python Data Representations, and Python Data Analysis. We will learn how to install external packages for use within Python, acquire data from sources on the Web, and then we will clean, process, analyze, and visualize that data. This course will combine the skills learned throughout the specialization to enable you to write interesting, practical, and useful programs.
By the end of the course, you will be comfortable installing Python packages, analyzing existing data, and generating visualizations of that data. This course will complete your education as a scripter, enabling you to locate, install, and use Python packages written by others. You will be able to effectively utilize tools and packages that are widely available to amplify your effectiveness and write useful programs.
Popular Internships and Jobs by Categories
Find Jobs & Internships
Browse
© 2024 BoostGrad | All rights reserved