Back to Courses


Data Science Courses - Page 4
Showing results 31-40 of 1407
The Social and Technical Context of Health Informatics
Improving health and healthcare institutions requires understanding of data and creation of interventions at the many levels at which health IT interact and affect the institution. These levels range from the external “world” in which the institution operates down to the specific technologies. Data scientists find that, when they aim at implementing their models in practice, it is the “socio” components that are both novel to them and mission critical to success. At the end of this course, students will be able to make a quick assessment of a health informatics problem—or a proposed solution—and to determine what is missing and what more needs to be learned.
Who Is This Class For?
Physicians, nurses, pharmacists, social workers, and other allied health professionals interested in expanding their understanding of digital health, big data, health information systems, and the unintended consequences of disruptive innovation in the healthcare system. The course is also aimed at those with technical, engineering, or analytics backgrounds who want to understand the nuances of those topics when it comes to healthcare.
Materials Data Sciences and Informatics
This course aims to provide a succinct overview of the emerging discipline of Materials Informatics at the intersection of materials science, computational science, and information science. Attention is drawn to specific opportunities afforded by this new field in accelerating materials development and deployment efforts. A particular emphasis is placed on materials exhibiting hierarchical internal structures spanning multiple length/structure scales and the impediments involved in establishing invertible process-structure-property (PSP) linkages for these materials. More specifically, it is argued that modern data sciences (including advanced statistics, dimensionality reduction, and formulation of metamodels) and innovative cyberinfrastructure tools (including integration platforms, databases, and customized tools for enhancement of collaborations among cross-disciplinary team members) are likely to play a critical and pivotal role in addressing the above challenges.
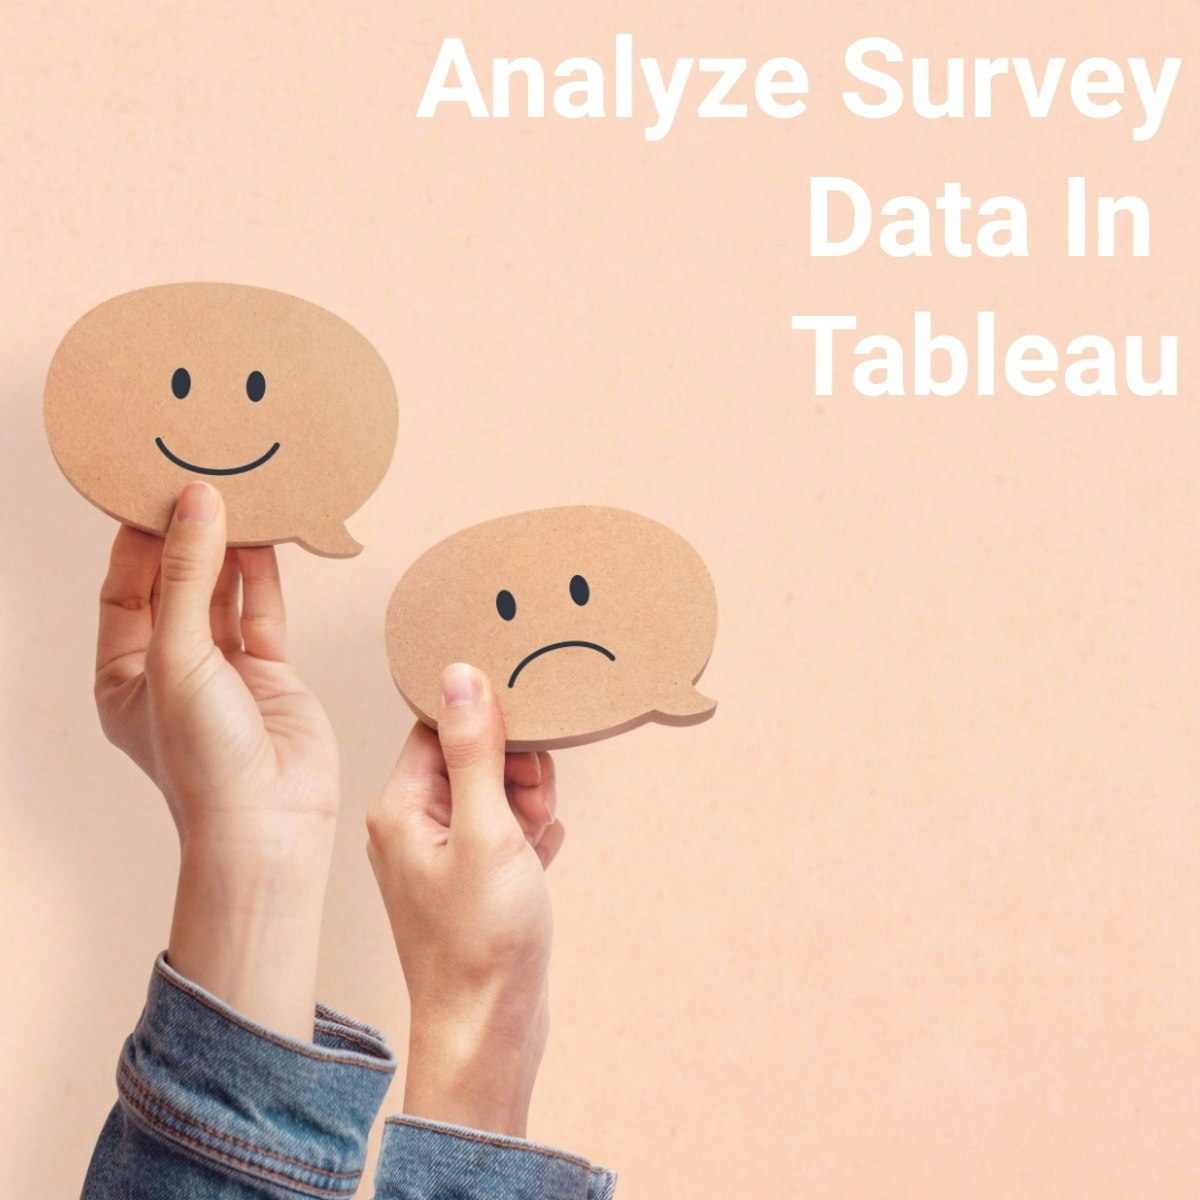
Analyze Survey Data with Tableau
Surveys are used in a variety of scenarios, both in businesses and in research. Companies are using them to better understand consumer insights and feedback, and researchers are going beyond the traditional uses to learn more about the world around us. Tableau can help visualize survey data of all kinds in a useful way—without needing advanced statistics, graphic design, or a statistics background.
In this project, learners will learn how to create an account in Tableau and how to manipulate data with joins and pivots. Students will then learn how to create different kinds of visualizations, including tables, pie charts, and a stacked pie chart.
This would be a great project for business and academic uses of survey data.
This project is designed to be used by those somewhat familiar with Tableau and data visualizations. But the project can be accessible for those new to Tableau as well.
Essential Design Principles for Tableau
In this course, you will analyze and apply essential design principles to your Tableau visualizations. This course assumes you understand the tools within Tableau and have some knowledge of the fundamental concepts of data visualization. You will define and examine the similarities and differences of exploratory and explanatory analysis as well as begin to ask the right questions about what’s needed in a visualization. You will assess how data and design work together, including how to choose the appropriate visual representation for your data, and the difference between effective and ineffective visuals. You will apply effective best practice design principles to your data visualizations and be able to illustrate examples of strategic use of contrast to highlight important elements. You will evaluate pre-attentive attributes and why they are important in visualizations. You will exam the importance of using the "right" amount of color and in the right place and be able to apply design principles to de-clutter your data visualization.
ML Pipelines on Google Cloud
In this course, you will be learning from ML Engineers and Trainers who work with the state-of-the-art development of ML pipelines here at Google Cloud. The first few modules will cover about TensorFlow Extended (or TFX), which is Google’s production machine learning platform based on TensorFlow for management of ML pipelines and metadata. You will learn about pipeline components and pipeline orchestration with TFX. You will also learn how you can automate your pipeline through continuous integration and continuous deployment, and how to manage ML metadata.
Then we will change focus to discuss how we can automate and reuse ML pipelines across multiple ML frameworks such as tensorflow, pytorch, scikit learn, and xgboost. You will also learn how to use another tool on Google Cloud, Cloud Composer, to orchestrate your continuous training pipelines. And finally, we will go over how to use MLflow for managing the complete machine learning life cycle.
Please take note that this is an advanced level course and to get the most out of this course, ideally you have the following prerequisites:
You have a good ML background and have been creating/deploying ML pipelines
You have completed the courses in the ML with Tensorflow on GCP specialization (or at least a few courses)
You have completed the MLOps Fundamentals course.
>>> By enrolling in this course you agree to the Qwiklabs Terms of Service as set out in the FAQ and located at: https://qwiklabs.com/terms_of_service <<<
Fundamentals of Scalable Data Science
Apache Spark is the de-facto standard for large scale data processing. This is the first course of a series of courses towards the IBM Advanced Data Science Specialization. We strongly believe that is is crucial for success to start learning a scalable data science platform since memory and CPU constraints are to most limiting factors when it comes to building advanced machine learning models.
In this course we teach you the fundamentals of Apache Spark using python and pyspark. We'll introduce Apache Spark in the first two weeks and learn how to apply it to compute basic exploratory and data pre-processing tasks in the last two weeks. Through this exercise you'll also be introduced to the most fundamental statistical measures and data visualization technologies.
This gives you enough knowledge to take over the role of a data engineer in any modern environment. But it gives you also the basis for advancing your career towards data science.
Please have a look at the full specialization curriculum:
https://www.coursera.org/specializations/advanced-data-science-ibm
If you choose to take this course and earn the Coursera course certificate, you will also earn an IBM digital badge. To find out more about IBM digital badges follow the link ibm.biz/badging.
After completing this course, you will be able to:
• Describe how basic statistical measures, are used to reveal patterns within the data
• Recognize data characteristics, patterns, trends, deviations or inconsistencies, and potential outliers.
• Identify useful techniques for working with big data such as dimension reduction and feature selection methods
• Use advanced tools and charting libraries to:
o improve efficiency of analysis of big-data with partitioning and parallel analysis
o Visualize the data in an number of 2D and 3D formats (Box Plot, Run Chart, Scatter Plot, Pareto Chart, and Multidimensional Scaling)
For successful completion of the course, the following prerequisites are recommended:
• Basic programming skills in python
• Basic math
• Basic SQL (you can get it easily from https://www.coursera.org/learn/sql-data-science if needed)
In order to complete this course, the following technologies will be used:
(These technologies are introduced in the course as necessary so no previous knowledge is required.)
• Jupyter notebooks (brought to you by IBM Watson Studio for free)
• ApacheSpark (brought to you by IBM Watson Studio for free)
• Python
We've been reported that some of the material in this course is too advanced. So in case you feel the same, please have a look at the following materials first before starting this course, we've been reported that this really helps.
Of course, you can give this course a try first and then in case you need, take the following courses / materials. It's free...
https://cognitiveclass.ai/learn/spark
https://dataplatform.cloud.ibm.com/analytics/notebooks/v2/f8982db1-5e55-46d6-a272-fd11b670be38/view?access_token=533a1925cd1c4c362aabe7b3336b3eae2a99e0dc923ec0775d891c31c5bbbc68
This course takes four weeks, 4-6h per week
Stability and Capability in Quality Improvement
In this course, you will learn to analyze data in terms of process stability and statistical control and why having a stable process is imperative prior to perform statistical hypothesis testing. You will create statistical process control charts for both continuous and discrete data using R software. You will analyze data sets for statistical control using control rules based on probability. Additionally, you will learn how to assess a process with respect to how capable it is of meeting specifications, either internal or external, and make decisions about process improvement.
This course can be taken for academic credit as part of CU Boulder’s Master of Science in Data Science (MS-DS) degree offered on the Coursera platform. The MS-DS is an interdisciplinary degree that brings together faculty from CU Boulder’s departments of Applied Mathematics, Computer Science, Information Science, and others. With performance-based admissions and no application process, the MS-DS is ideal for individuals with a broad range of undergraduate education and/or professional experience in computer science, information science, mathematics, and statistics. Learn more about the MS-DS program at https://www.coursera.org/degrees/master-of-science-data-science-boulder.
Supervised Machine Learning: Regression
This course introduces you to one of the main types of modelling families of supervised Machine Learning: Regression. You will learn how to train regression models to predict continuous outcomes and how to use error metrics to compare across different models. This course also walks you through best practices, including train and test splits, and regularization techniques.
By the end of this course you should be able to:
Differentiate uses and applications of classification and regression in the context of supervised machine learning
Describe and use linear regression models
Use a variety of error metrics to compare and select a linear regression model that best suits your data
Articulate why regularization may help prevent overfitting
Use regularization regressions: Ridge, LASSO, and Elastic net
Who should take this course?
This course targets aspiring data scientists interested in acquiring hands-on experience with Supervised Machine Learning Regression techniques in a business setting.
What skills should you have?
To make the most out of this course, you should have familiarity with programming on a Python development environment, as well as fundamental understanding of Data Cleaning, Exploratory Data Analysis, Calculus, Linear Algebra, Probability, and Statistics.
Interpretable Machine Learning Applications: Part 1
In this 1-hour long project-based course, you will learn how to create interpretable machine learning applications on the example of two classification regression models, decision tree and random forestc classifiers. You will also learn how to explain such prediction models by extracting the most important features and their values, which mostly impact these prediction models. In this sense, the project will boost your career as Machine Learning (ML) developer and modeler in that you will be able to get a deeper insight into the behaviour of your ML model. The project will also benefit your career as a decision maker in an executive position, or consultant, interested in deploying trusted and accountable ML applications.
Note: This course works best for learners who are based in the North America region. We’re currently working on providing the same experience in other regions.
Deep Learning with PyTorch : GradCAM
Gradient-weighted Class Activation Mapping (Grad-CAM), uses the class-specific gradient information flowing into the final convolutional layer of a CNN to produce a coarse localization map of the important regions in the image. In this 2-hour long project-based course, you will implement GradCAM on simple classification dataset. You will write a custom dataset class for Image-Classification dataset. Thereafter, you will create custom CNN architecture. Moreover, you are going to create train function and evaluator function which will be helpful to write the training loop. After, saving the best model, you will write GradCAM function which return the heatmap of localization map of a given class. Lastly, you plot the heatmap which the given input image.
Popular Internships and Jobs by Categories
Find Jobs & Internships
Browse


© 2024 BoostGrad | All rights reserved