Back to Courses


Data Science Courses - Page 3
Showing results 21-30 of 1407
Build an End-to-End Data Capture Pipeline using Document AI
This is a self-paced lab that takes place in the Google Cloud console. In this lab you use Cloud Functions and Pub/Sub to create an end-to-end document processing pipeline using Document AI. The Document AI API is a document understanding solution that takes unstructured data, such as documents and emails, and makes the data easier to understand, analyze, and consume.
In this lab, you will create a document processing pipeline that will automatically process documents that are uploaded to Cloud Storage. The pipeline consists of a primary Cloud Function that processes new files that are uploaded to Cloud Storage using a Document AI form processor and then saves form data detected in those files to BigQuery. If the form data includes any address fields the address data is then written to a Pub/Sub topic that in turn triggers a second Cloud Function that uses to Geocoding API to provide geographic coordinate data for the address that is also written to BigQuery.
This is a simple pipeline that uses a general form processor that will detect basic form data, such as a labelled field containing address information. Document AI processors that use one of the specialized parsers that are beyond the scope of this lab provide enhanced entity information for specific document types even when those documents do not include labelled fields. For example, a Document AI Invoice parser can provide detailed address and supplier information, from an unlabelled invoice document because it understands the layout of invoices.
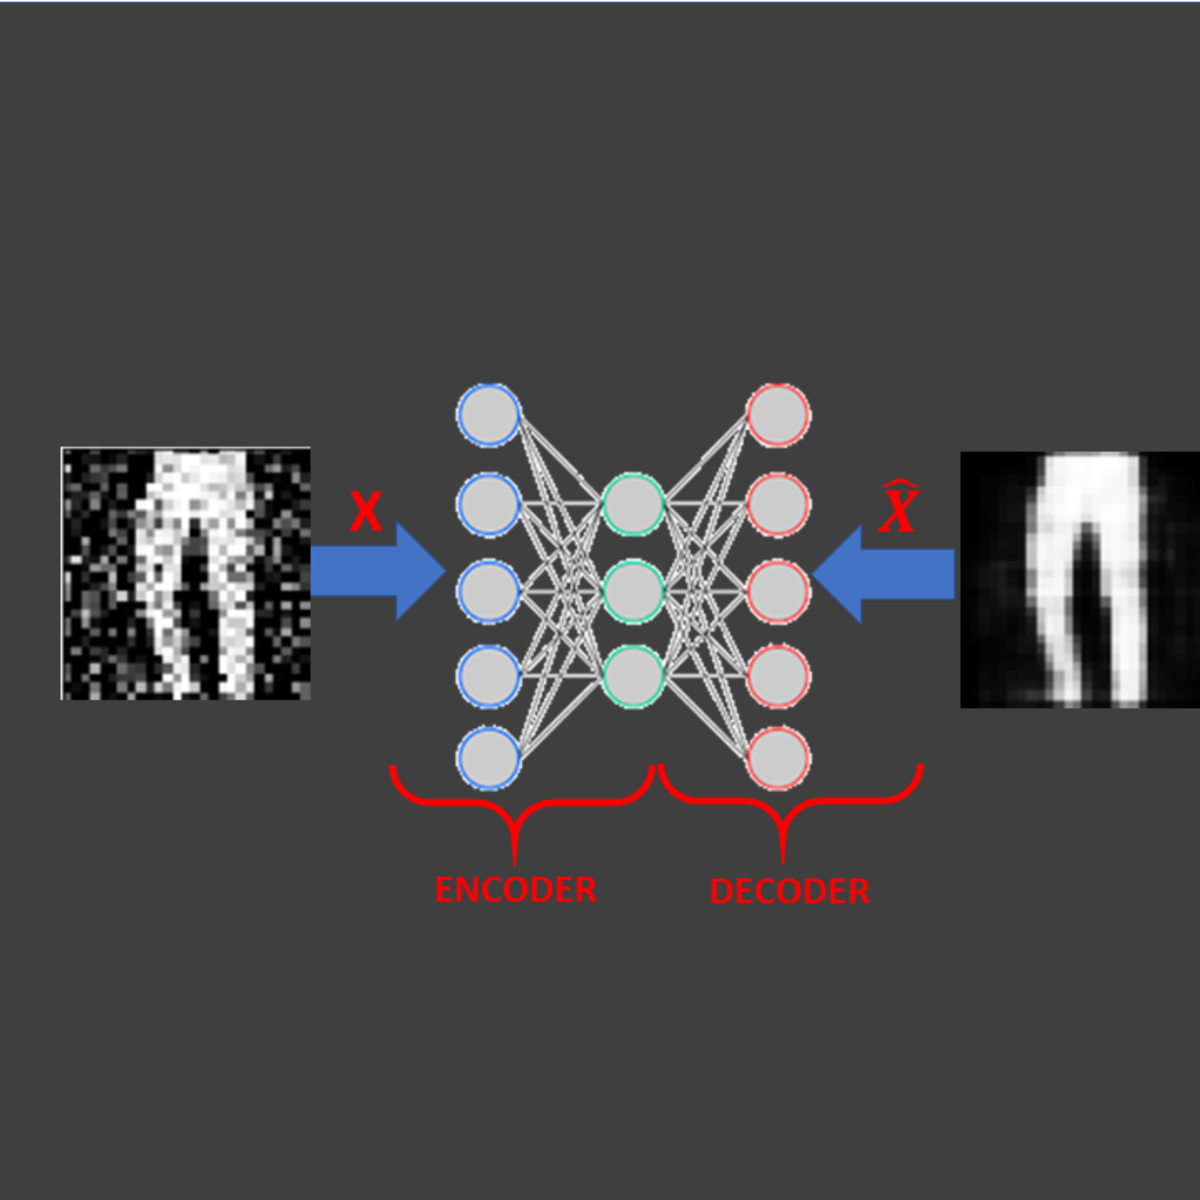
Image Denoising Using AutoEncoders in Keras and Python
In this 1-hour long project-based course, you will be able to:
- Understand the theory and intuition behind Autoencoders
- Import Key libraries, dataset and visualize images
- Perform image normalization, pre-processing, and add random noise to images
- Build an Autoencoder using Keras with Tensorflow 2.0 as a backend
- Compile and fit Autoencoder model to training data
- Assess the performance of trained Autoencoder using various KPIs
Note: This course works best for learners who are based in the North America region. We’re currently working on providing the same experience in other regions.
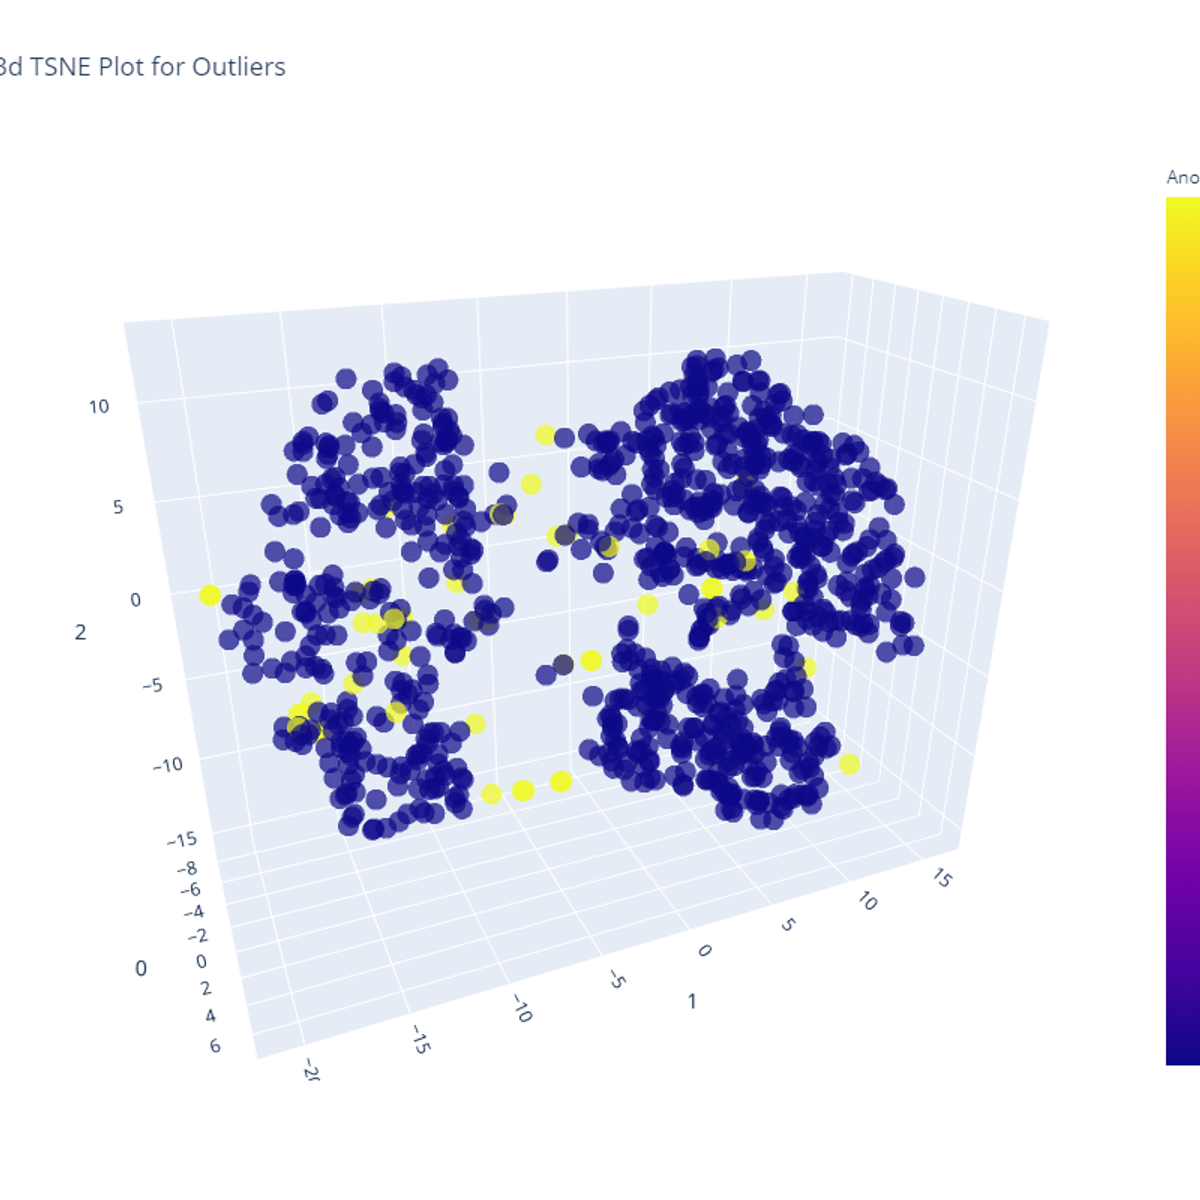
Build an Anomaly Detection Model using PyCaret
Build an Anomaly Detection Model using PyCaret
Fundamentals of Visualization with Tableau
In this first course of this specialization, you will discover what data visualization is, and how we can use it to better see and understand data. Using Tableau, we’ll examine the fundamental concepts of data visualization and explore the Tableau interface, identifying and applying the various tools Tableau has to offer. By the end of the course you will be able to prepare and import data into Tableau and explain the relationship between data analytics and data visualization. This course is designed for the learner who has never used Tableau before, or who may need a refresher or want to explore Tableau in more depth. No prior technical or analytical background is required. The course will guide you through the steps necessary to create your first visualization from the beginning based on data context, setting the stage for you to advance to the next course in the Specialization.
Data Analysis Tools
In this course, you will develop and test hypotheses about your data. You will learn a variety of statistical tests, as well as strategies to know how to apply the appropriate one to your specific data and question. Using your choice of two powerful statistical software packages (SAS or Python), you will explore ANOVA, Chi-Square, and Pearson correlation analysis. This course will guide you through basic statistical principles to give you the tools to answer questions you have developed. Throughout the course, you will share your progress with others to gain valuable feedback and provide insight to other learners about their work.
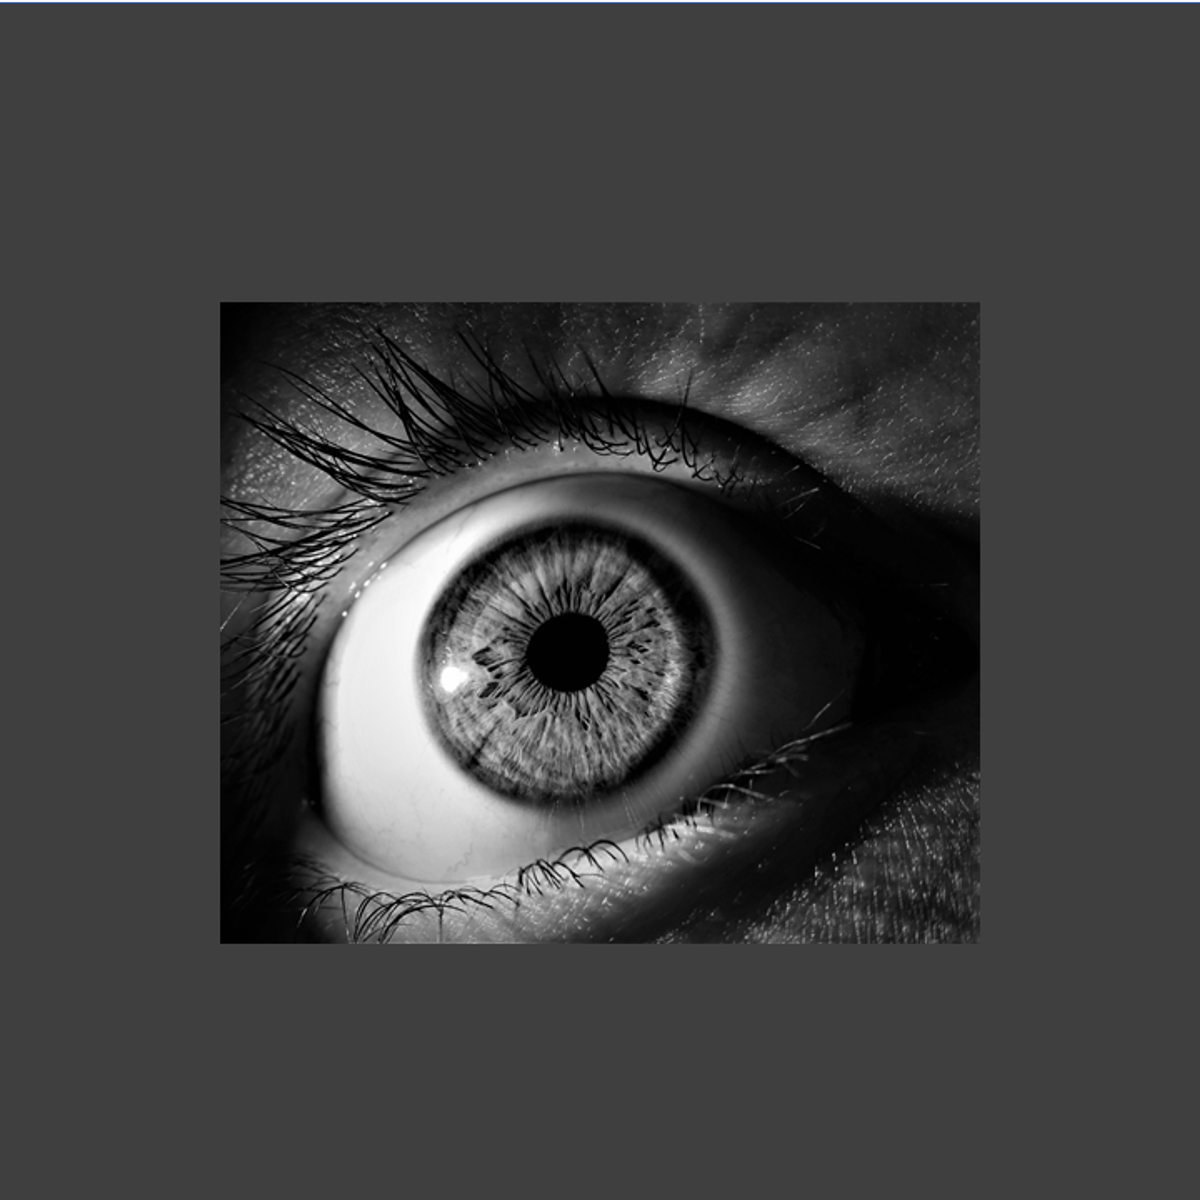
Diabetic Retinopathy Detection with Artificial Intelligence
In this project, we will train deep neural network model based on Convolutional Neural Networks (CNNs) and Residual Blocks to detect the type of Diabetic Retinopathy from images. Diabetic Retinopathy is the leading cause of blindness in the working-age population of the developed world and estimated to affect over 347 million people worldwide. Diabetic Retinopathy is disease that results from complication of type 1 & 2 diabetes and can develop if blood sugar levels are left uncontrolled for a prolonged period of time. With the power of Artificial Intelligence and Deep Learning, doctors will be able to detect blindness before it occurs.
Image Classification with CNNs using Keras
In this 1-hour long project-based course, you will learn how to create a Convolutional Neural Network (CNN) in Keras with a TensorFlow backend, and you will learn to train CNNs to solve Image Classification problems. In this project, we will create and train a CNN model on a subset of the popular CIFAR-10 dataset.
This course runs on Coursera's hands-on project platform called Rhyme. On Rhyme, you do projects in a hands-on manner in your browser. You will get instant access to pre-configured cloud desktops containing all of the software and data you need for the project. Everything is already set up directly in your Internet browser so you can just focus on learning. For this project, you’ll get instant access to a cloud desktop with (e.g. Python, Jupyter, and Tensorflow) pre-installed.
Prerequisites:
In order to be successful in this project, you should be familiar with python and convolutional neural networks.
Notes:
- You will be able to access the cloud desktop 5 times. However, you will be able to access instructions videos as many times as you want.
- This course works best for learners who are based in the North America region. We’re currently working on providing the same experience in other regions.
Python Programming Essentials
This course will introduce you to the wonderful world of Python programming! We'll learn about the essential elements of programming and how to construct basic Python programs. We will cover expressions, variables, functions, logic, and conditionals, which are foundational concepts in computer programming. We will also teach you how to use Python modules, which enable you to benefit from the vast array of functionality that is already a part of the Python language. These concepts and skills will help you to begin to think like a computer programmer and to understand how to go about writing Python programs.
By the end of the course, you will be able to write short Python programs that are able to accomplish real, practical tasks. This course is the foundation for building expertise in Python programming. As the first course in a specialization, it provides the necessary building blocks for you to succeed at learning to write more complex Python programs.
This course uses Python 3. While many Python programs continue to use Python 2, Python 3 is the future of the Python programming language. This first course will use a Python 3 version of the CodeSkulptor development environment, which is specifically designed to help beginning programmers learn quickly. CodeSkulptor runs within any modern web browser and does not require you to install any software, allowing you to start writing and running small programs immediately. In the later courses in this specialization, we will help you to move to more sophisticated desktop development environments.
Introduction to Deep Learning & Neural Networks with Keras
Looking to start a career in Deep Learning? Look no further. This course will introduce you to the field of deep learning and help you answer many questions that people are asking nowadays, like what is deep learning, and how do deep learning models compare to artificial neural networks? You will learn about the different deep learning models and build your first deep learning model using the Keras library.
After completing this course, learners will be able to:
• Describe what a neural network is, what a deep learning model is, and the difference between them.
• Demonstrate an understanding of unsupervised deep learning models such as autoencoders and restricted Boltzmann machines.
• Demonstrate an understanding of supervised deep learning models such as convolutional neural networks and recurrent networks.
• Build deep learning models and networks using the Keras library.
Facial Keypoint Detection with PyTorch
In this 2-hour project-based course, you will be able to :
- Understand the Facial Keypoint Dataset and you will write a custom dataset class for Image-Keypoint dataset. Additionally, you will apply keypoint augmentation to augment images as well as its keypoints. For keypoint augmentation you will use albumentation library. You will plot the image keypoint pair.
- Load a pretrained state of the art convolutional neural network using timm library.
- Create train function and evaluator function which will helpful to write training loop. Moreover, you will use training loop to train the model.
- Lastly, you will use trained model to find keypoints given any image.
Popular Internships and Jobs by Categories
Find Jobs & Internships
Browse


© 2024 BoostGrad | All rights reserved