Back to Courses


Data Science Courses - Page 2
Showing results 11-20 of 1407
Advanced AI Techniques for the Supply Chain
In this course, we’ll learn about more advanced machine learning methods that are used to tackle problems in the supply chain. We’ll start with an overview of the different ML paradigms (regression/classification) and where the latest models fit into these breakdowns. Then, we’ll dive deeper into some of the specific techniques and use cases such as using neural networks to predict product demand and random forests to classify products. An important part to using these models is understanding their assumptions and required preprocessing steps. We’ll end with a project incorporating advanced techniques with an image classification problem to find faulty products coming out of a machine.
Natural Language Processing on Google Cloud
This course is an introduction to sequence models and their applications, including an overview of sequence model architectures and how to handle inputs of variable length.
• Predict future values of a time-series
• Classify free form text
• Address time-series and text problems with recurrent neural networks
• Choose between RNNs/LSTMs and simpler models
• Train and reuse word embeddings in text problems
You will get hands-on practice building and optimizing your own text classification and sequence models on a variety of public datasets in the labs we’ll work on together.
Prerequisites: Basic SQL, familiarity with Python and TensorFlow
Bracketology with Google Machine Learning
This is a self-paced lab that takes place in the Google Cloud console. In this lab you use Machine Learning (ML) to analyze the public NCAA dataset and predict NCAA tournament brackets.
Introduction to virtual networks in Microsoft Azure
This is an introductory project on creating Virtual Networks in the Azure Portal.
During each task, you'll be able to follow along and complete each step as I do, giving you a truly hands-on experience.
I will begin by showing you how to get started with Azure by creating an account and signing in.
From there we will get familiar with navigating the Azure Portal and begin the creation of our Azure virtual network. We will accomplish this by working our way through the various settings that will need to be configured for a successful configuration of our virtual network.
Once the virtual network is created and operational, we will then create and connect two cloud based virtual machines and test connectivity between them.
If you enjoy this project, we'd recommend exploring the Microsoft Azure Fundamentals AZ-900 Exam Prep Specialization: https://www.coursera.org/specializations/microsoft-azure-fundamentals-az-900
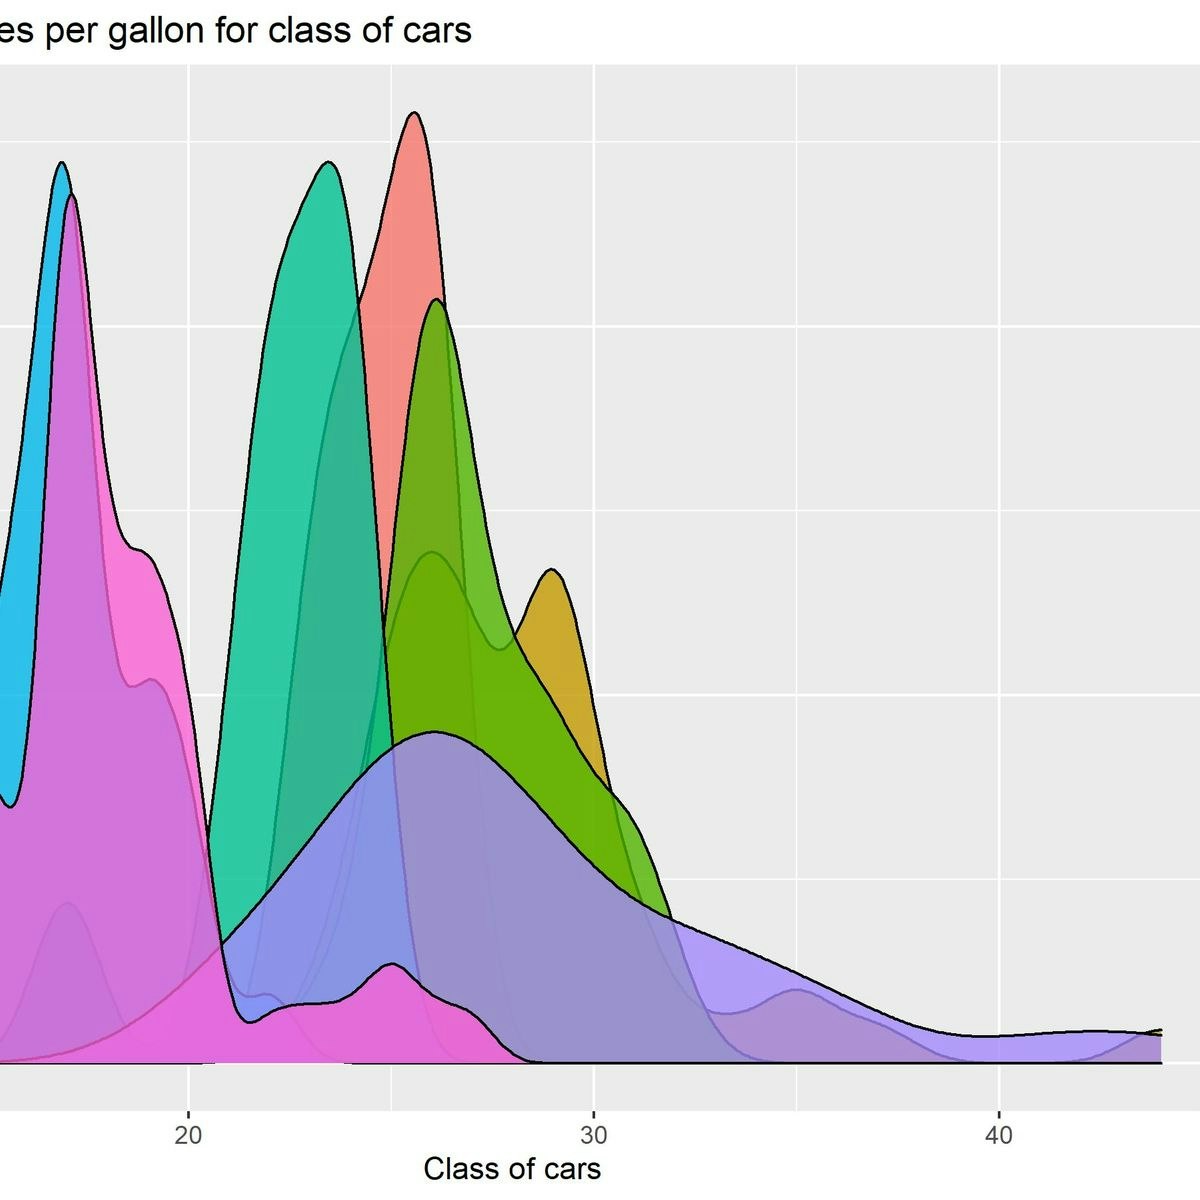
Introduction to EDA in R
Welcome to this project-based course Introduction to EDA in R. In this project, you will learn how to perform extensive exploratory data analysis on both quantitative and qualitative variables using basic R functions.
By the end of this 2-hour long project, you will understand how to create different basic plots in R. Also, you will learn how to create plots for categorical variables and numeric or quantitative variables. By extension, you will learn how to plot three variables and save your plot as an image in R.
Note, you do not need to be a data scientist to be successful in this guided project, just a familiarity with basic statistics and using R suffice for this project. If you are not familiar with R and want to learn the basics, start with my previous guided projects titled “Getting Started with R” and “Calculating Descriptive Statistics in R”
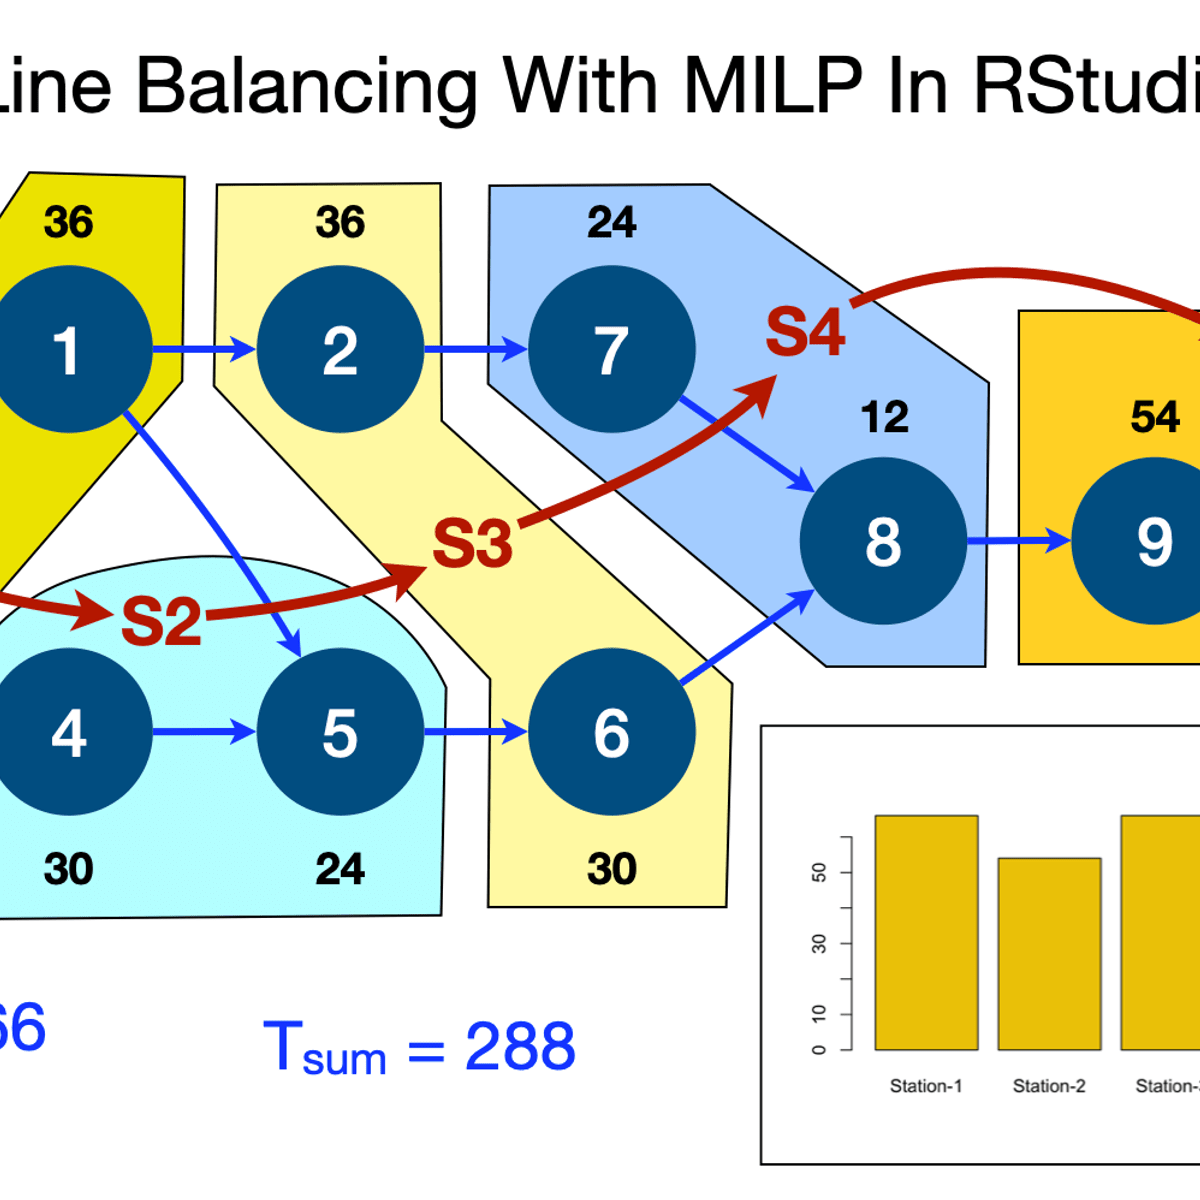
Line Balancing With MILP Optimization In RStudio
By the end of this project, you will learn to use R lpSolveAPI. You will learn to:
# Formulate Line Balancing Problem & Determine Objective Function
# Apply Constraints On Tasks Assignment To Stations
# Apply The Sum Of Durations Constraints On Tasks
# Apply Task Precedence Relationship Constraints
# Run Optimiser, Obtain & Analyse Solution
Object Detection Using Facebook's Detectron2
In this 2-hour long project-based course, you will learn how to train an Object Detection Model using Facebook's Detectron2. Detectron2 is a research platform and a production library for deep learning, built by Facebook AI Research (FAIR). We will be building an Object Detection Language Identification Model to identify English and Hindi texts written which can be extended to different use cases. We will look at the entire cycle of Model Development and Evaluation in Detectron2. We will first look at how to load a dataset, visualize it and prepare it as an input to the Deep Learning Model.
We will then look at how we can build a Faster R-CNN model in Detectron2 and customize it. We will then configure the parameters & hyperparameters of the model. We will then move on to training the Model and subsequently to model inference and evaluation.
Note: This course works best for learners who are based in the North America region. We’re currently working on providing the same experience in other regions.
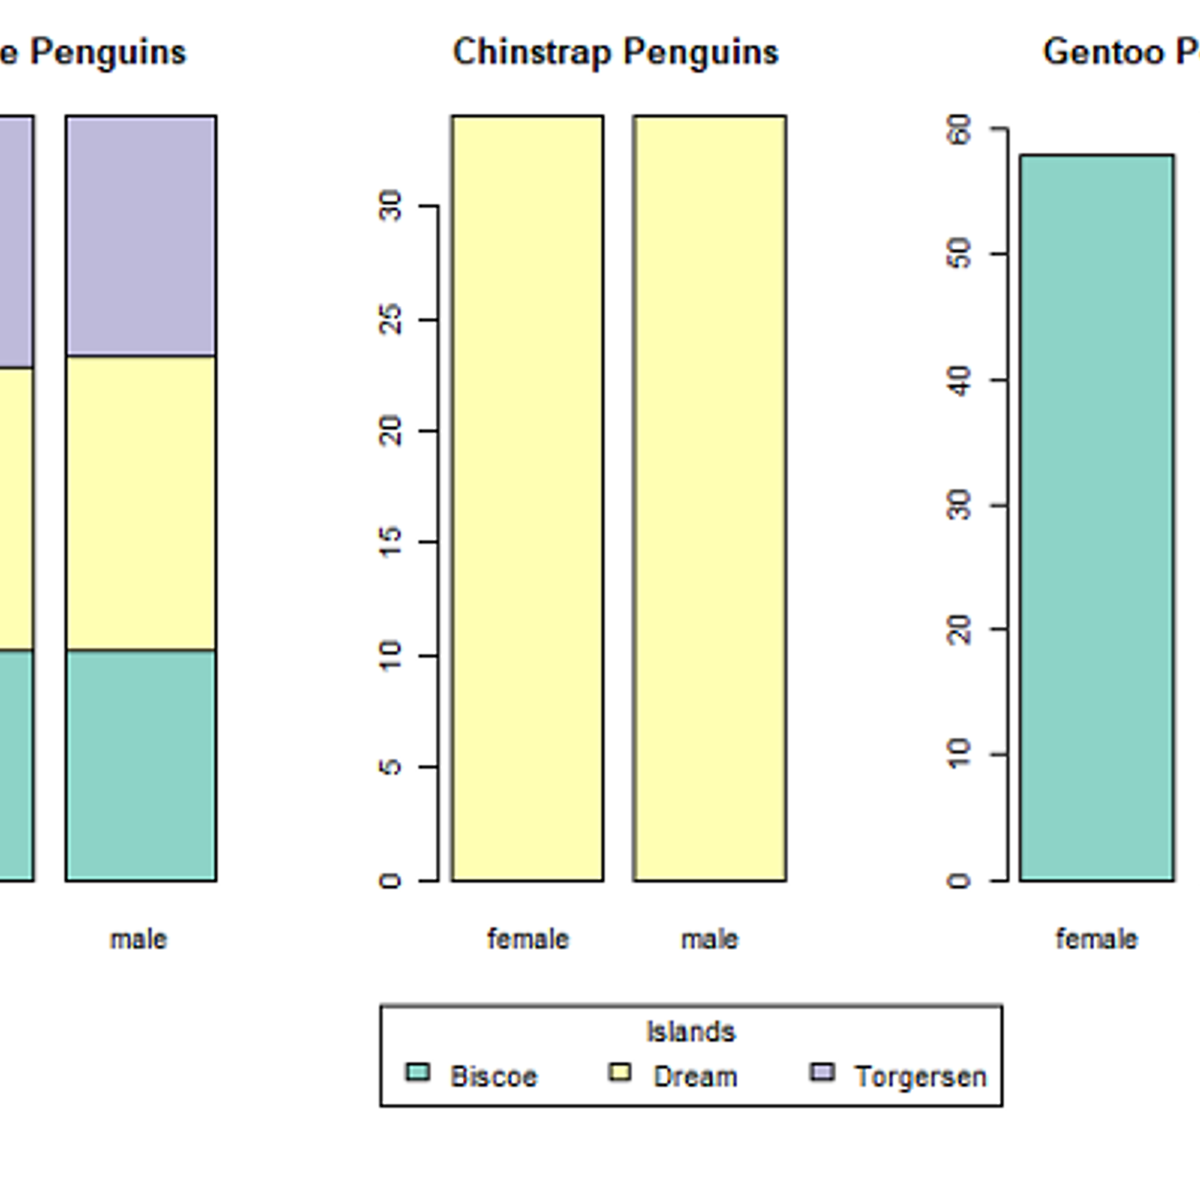
Visualization for Statistical Analysis
In this project you will learn about several visualization techniques and their importance for Statistical Analysis. The project demonstrates different plotting techniques, for example, histograms, scatter plots, box and whiskers plot, violin plot, bar plot, addition of regression line to scatter plot, and creating matrix of multiple plots. It also discusses the suitability of each plots according to the data type of the variables and illustrates multiple ways to achieve the desired plots efficiently. The project refers to 'Palmer Penguins' data set for the illustrative purpose.
Introduction to Microsoft Excel
By the end of this project, you will learn how to create an Excel Spreadsheet by using a free version of Microsoft Office Excel.
Excel is a spreadsheet that works like a database. It consists of individual cells that can be used to build functions, formulas, tables, and graphs that easily organize and analyze large amounts of information and data. Excel is organized into rows (represented by numbers) and columns (represented by letters) that contain your information. This format allows you to present large amounts of information and data in a concise and easy to follow format. Microsoft Excel is the most widely used software within the business community. Whether it is bankers or accountants or business analysts or marketing professionals or scientists or entrepreneurs, almost all professionals use Excel on a consistent basis.
You will learn what an Excel Spreadsheet is, why we use it and the most important keyboard shortcuts, functions, and basic formulas.
Introduction to Text Classification in R with quanteda
In this guided project you will learn how to import textual data stored in raw text files into R, turn these files into a corpus (a collection of textual documents), reshape them into paragraphs from documents and tokenize the text all using the R software package quanteda. You will then learn how to classify the texts using the Naive Bayes algorithm.
This guided project is for beginners interested in quantitative text analysis in R. It assumes no knowledge of textual analysis and focuses on exploring textual data (US Presidential Concession Speeches). Users should have a basic understanding of the statistical programming language R.
Popular Internships and Jobs by Categories
Find Jobs & Internships
Browse


© 2024 BoostGrad | All rights reserved