
Back to Courses


Data Science Courses - Page 128
Showing results 1271-1280 of 1407
Calculus through Data & Modelling: Integration Applications
This course continues your study of calculus by focusing on the applications of integration. The applications in this section have many common features. First, each is an example of a quantity that is computed by evaluating a definite integral. Second, the formula for that application is derived from Riemann sums.
Rather than measure rates of change as we did with differential calculus, the definite integral allows us to measure the accumulation of a quantity over some interval of input values. This notion of accumulation can be applied to different quantities, including money, populations, weight, area, volume, and air pollutants. The concepts in this course apply to many other disciplines outside of traditional mathematics.
We will expand the notion of the average value of a data set to allow for infinite values, develop the formula for arclength and curvature, and derive formulas for velocity, acceleration, and areas between curves. Through examples and projects, we will apply the tools of this course to analyze and model real world data.
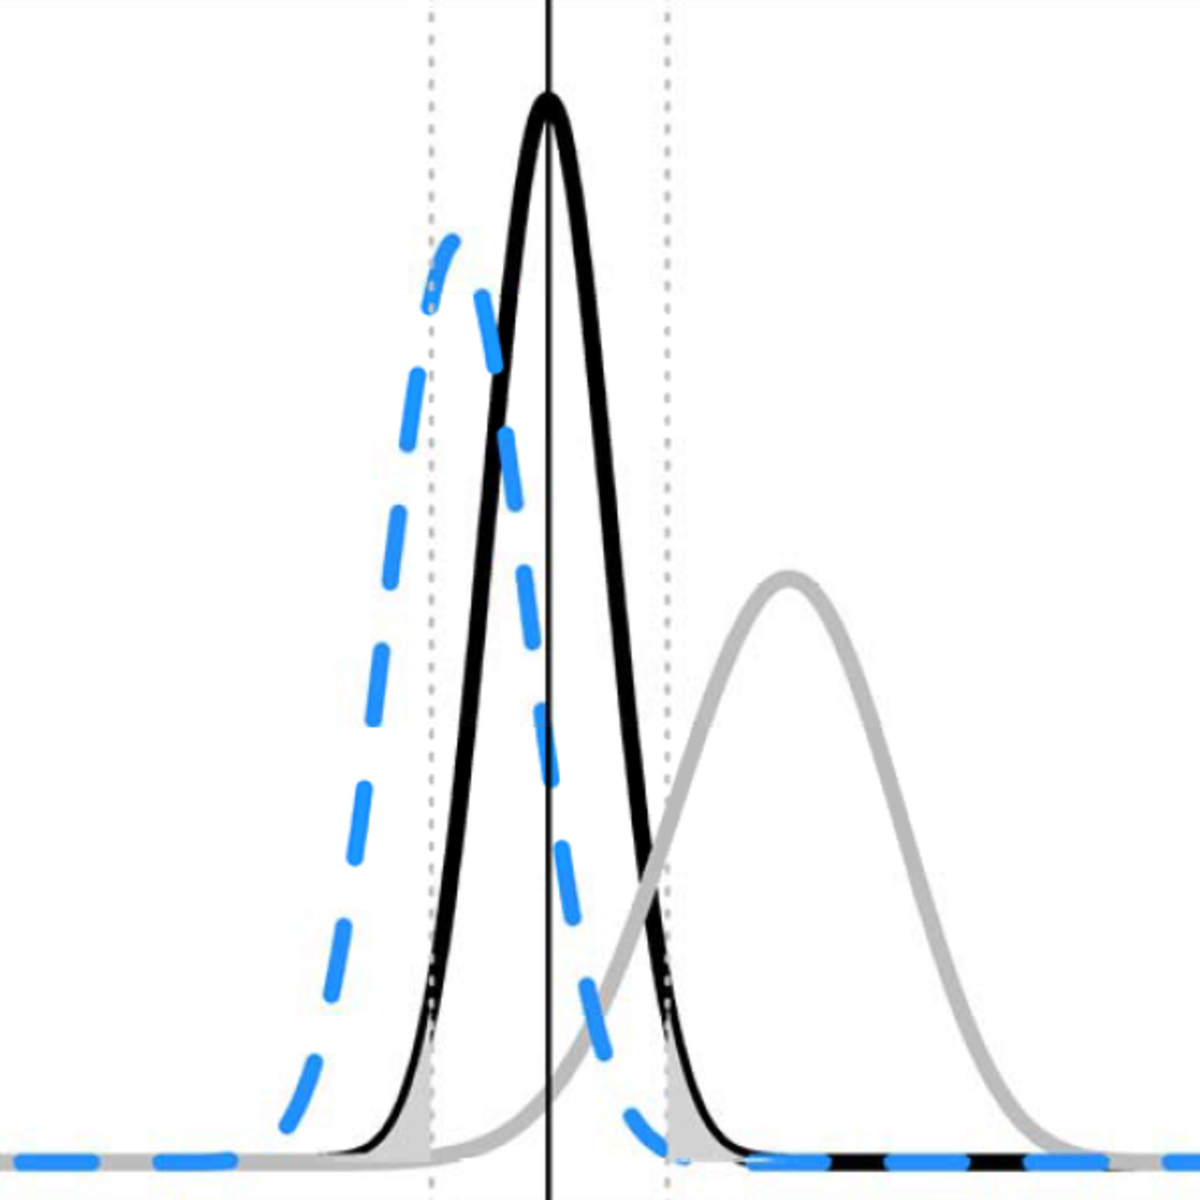
Improving your statistical inferences
This course aims to help you to draw better statistical inferences from empirical research. First, we will discuss how to correctly interpret p-values, effect sizes, confidence intervals, Bayes Factors, and likelihood ratios, and how these statistics answer different questions you might be interested in. Then, you will learn how to design experiments where the false positive rate is controlled, and how to decide upon the sample size for your study, for example in order to achieve high statistical power. Subsequently, you will learn how to interpret evidence in the scientific literature given widespread publication bias, for example by learning about p-curve analysis. Finally, we will talk about how to do philosophy of science, theory construction, and cumulative science, including how to perform replication studies, why and how to pre-register your experiment, and how to share your results following Open Science principles.
In practical, hands on assignments, you will learn how to simulate t-tests to learn which p-values you can expect, calculate likelihood ratio's and get an introduction the binomial Bayesian statistics, and learn about the positive predictive value which expresses the probability published research findings are true. We will experience the problems with optional stopping and learn how to prevent these problems by using sequential analyses. You will calculate effect sizes, see how confidence intervals work through simulations, and practice doing a-priori power analyses. Finally, you will learn how to examine whether the null hypothesis is true using equivalence testing and Bayesian statistics, and how to pre-register a study, and share your data on the Open Science Framework.
All videos now have Chinese subtitles. More than 30.000 learners have enrolled so far!
If you enjoyed this course, I can recommend following it up with me new course "Improving Your Statistical Questions"
Serverless Data Processing with Dataflow: Foundations
This course is part 1 of a 3-course series on Serverless Data Processing with Dataflow. In this first course, we start with a refresher of what Apache Beam is and its relationship with Dataflow. Next, we talk about the Apache Beam vision and the benefits of the Beam Portability framework. The Beam Portability framework achieves the vision that a developer can use their favorite programming language with their preferred execution backend. We then show you how Dataflow allows you to separate compute and storage while saving money, and how identity, access, and management tools interact with your Dataflow pipelines. Lastly, we look at how to implement the right security model for your use case on Dataflow.
Prerequisites:
The Serverless Data Processing with Dataflow course series builds on the concepts covered in the Data Engineering specialization. We recommend the following prerequisite courses:
(i)Building batch data pipelines on Google Cloud : covers core Dataflow principles
(ii)Building Resilient Streaming Analytics Systems on Google Cloud : covers streaming basics concepts like windowing, triggers, and watermarks
>>> By enrolling in this course you agree to the Qwiklabs Terms of Service as set out in the FAQ and located at: https://qwiklabs.com/terms_of_service <<<
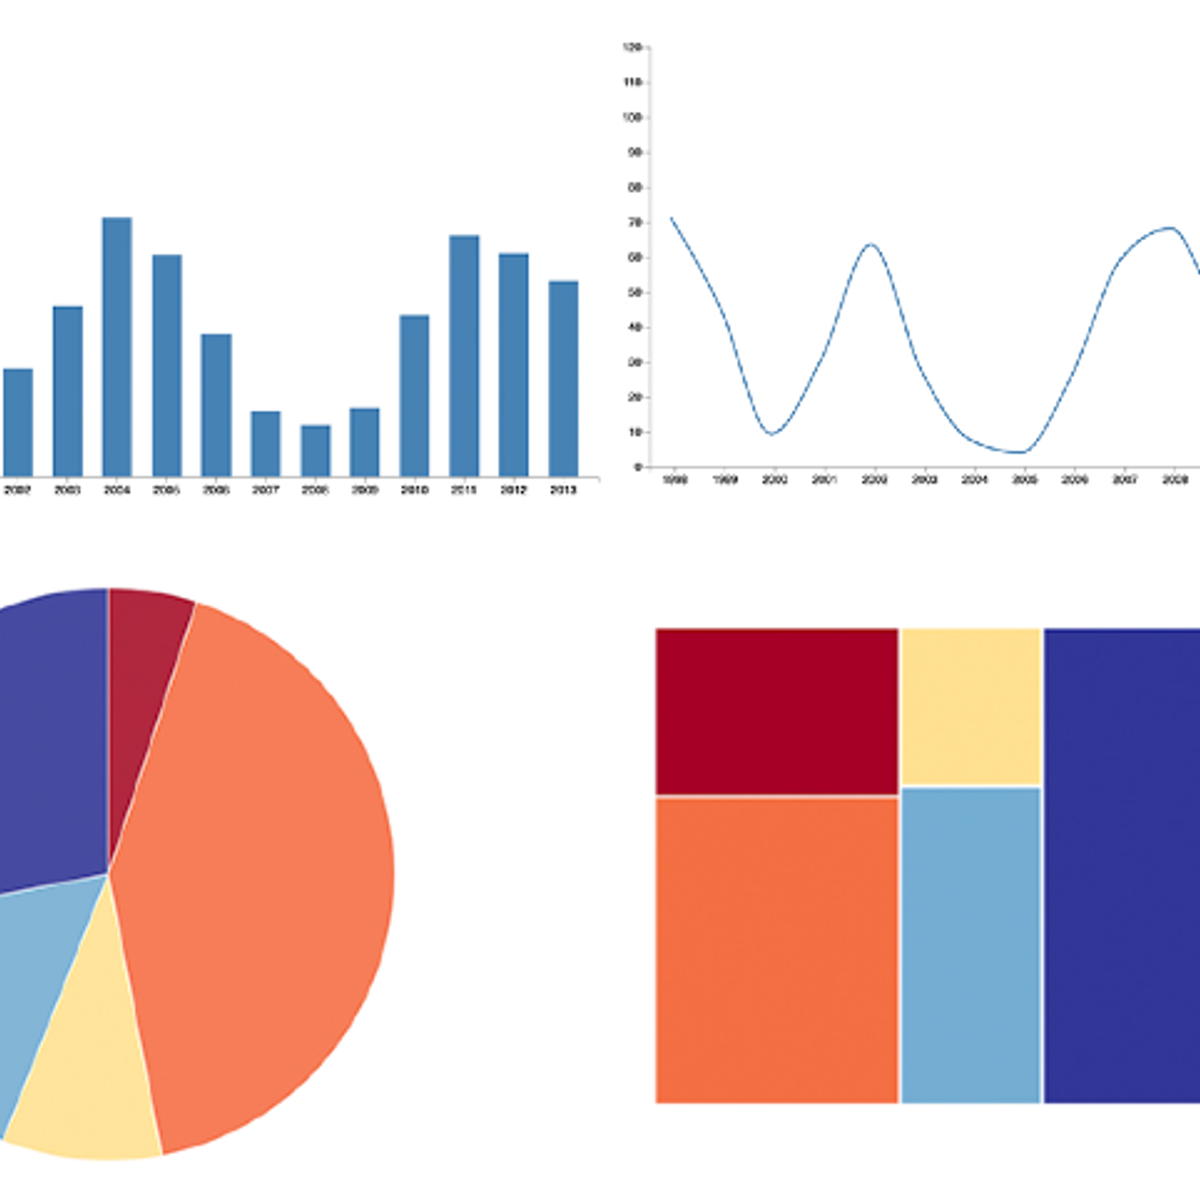
Fundamentals of Data Visualization
Data is everywhere. Charts, graphs, and other types of information visualizations help people to make sense of this data. This course explores the design, development, and evaluation of such information visualizations. By combining aspects of design, computer graphics, HCI, and data science, you will gain hands-on experience with creating visualizations, using exploratory tools, and architecting data narratives. Topics include user-centered design, web-based visualization, data cognition and perception, and design evaluation.
This course can be taken for academic credit as part of CU Boulder’s Master of Science in Data Science (MS-DS) degree offered on the Coursera platform. The MS-DS is an interdisciplinary degree that brings together faculty from CU Boulder’s departments of Applied Mathematics, Computer Science, Information Science, and others. With performance-based admissions and no application process, the MS-DS is ideal for individuals with a broad range of undergraduate education and/or professional experience in computer science, information science, mathematics, and statistics. Learn more about the MS-DS program at https://www.coursera.org/degrees/master-of-science-data-science-boulder.
Predict Diabetes with a Random Forest using R
In this 1-hour long project-based course, you will learn how to (complete a training and test set using an R function, practice looking at data distribution using R and ggplot2, Apply a Random Forest model to the data, and examine the results using RMSE and a Confusion Matrix).
Note: This course works best for learners who are based in the North America region. We’re currently working on providing the same experience in other regions.
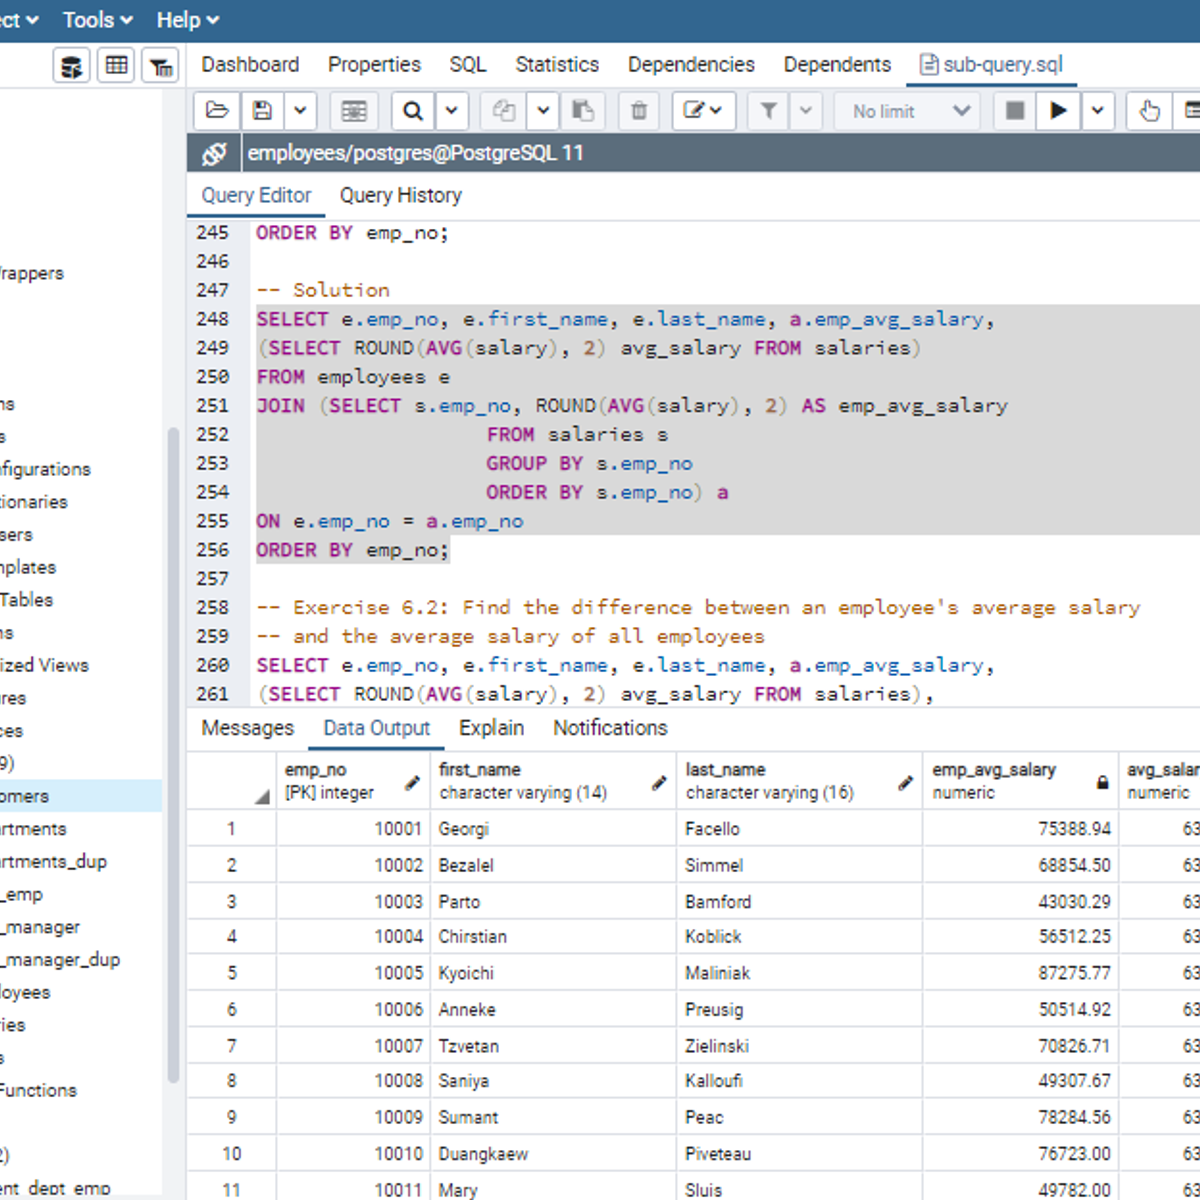
Working with Subqueries in SQL
Welcome to this project-based course, Working with Subqueries in SQL. In this project, you will learn how to use SQL subqueries extensively to query tables in a database.
By the end of this 2-and-a-half-hour-long project, you will be able to use subqueries in the WHERE clause, FROM clause, and the SELECT clause to retrieve the desired result from a database. In this project, we will move systematically by first introducing the use of subqueries in the WHERE clause. Then, we will use subqueries in the FROM and SELECT clause by writing slightly complex queries for real-life applications. Be assured that you will get your hands really dirty in this project because you will get to work on a lot of exercises to reinforce your knowledge of the concept.
Also, for this hands-on project, we will use PostgreSQL as our preferred database management system (DBMS). Therefore, to complete this project, it is required that you have prior experience with using PostgreSQL. Similarly, this project is an advanced SQL concept; so, a good foundation for writing SQL queries is vital to complete this project.
If you are not familiar with writing queries in SQL and want to learn these concepts, start with my previous guided projects titled “Querying Databases using SQL SELECT statement," and “Mastering SQL Joins.” I taught these guided projects using PostgreSQL. So, taking these projects will give the needed requisite to complete this Working with Subqueries in SQL project. However, if you are comfortable writing queries in PostgreSQL, please join me on this wonderful ride! Let’s get our hands dirty!
Advanced Clinical Data Science
This course prepares you to deal with advanced clinical data science topics and techniques including temporal and research quality analysis.
Cervical Cancer Risk Prediction Using Machine Learning
In this hands-on project, we will build and train an XG-Boost classifier to predict whether a person has a risk of having cervical cancer. Cervical cancer kills about 4,000 women in the U.S. and about 300,000 women worldwide.
Data has been obtained from 858 patients and include features such as number of pregnancies, smoking habits, Sexually Transmitted Disease (STD), demographics, and historic medical records.
Introduction to Genomic Technologies
This course introduces you to the basic biology of modern genomics and the experimental tools that we use to measure it. We'll introduce the Central Dogma of Molecular Biology and cover how next-generation sequencing can be used to measure DNA, RNA, and epigenetic patterns. You'll also get an introduction to the key concepts in computing and data science that you'll need to understand how data from next-generation sequencing experiments are generated and analyzed.
This is the first course in the Genomic Data Science Specialization.
Exploring and Preparing your Data with BigQuery
In this course, we see what the common challenges faced by data analysts are and how to solve them with the big data tools on Google Cloud. You’ll pick up some SQL along the way and become very familiar with using BigQuery and Dataprep to analyze and transform your datasets.
This is the first course of the From Data to Insights with Google Cloud series. After completing this course, enroll in the Creating New BigQuery Datasets and Visualizing Insights course.