
Back to Courses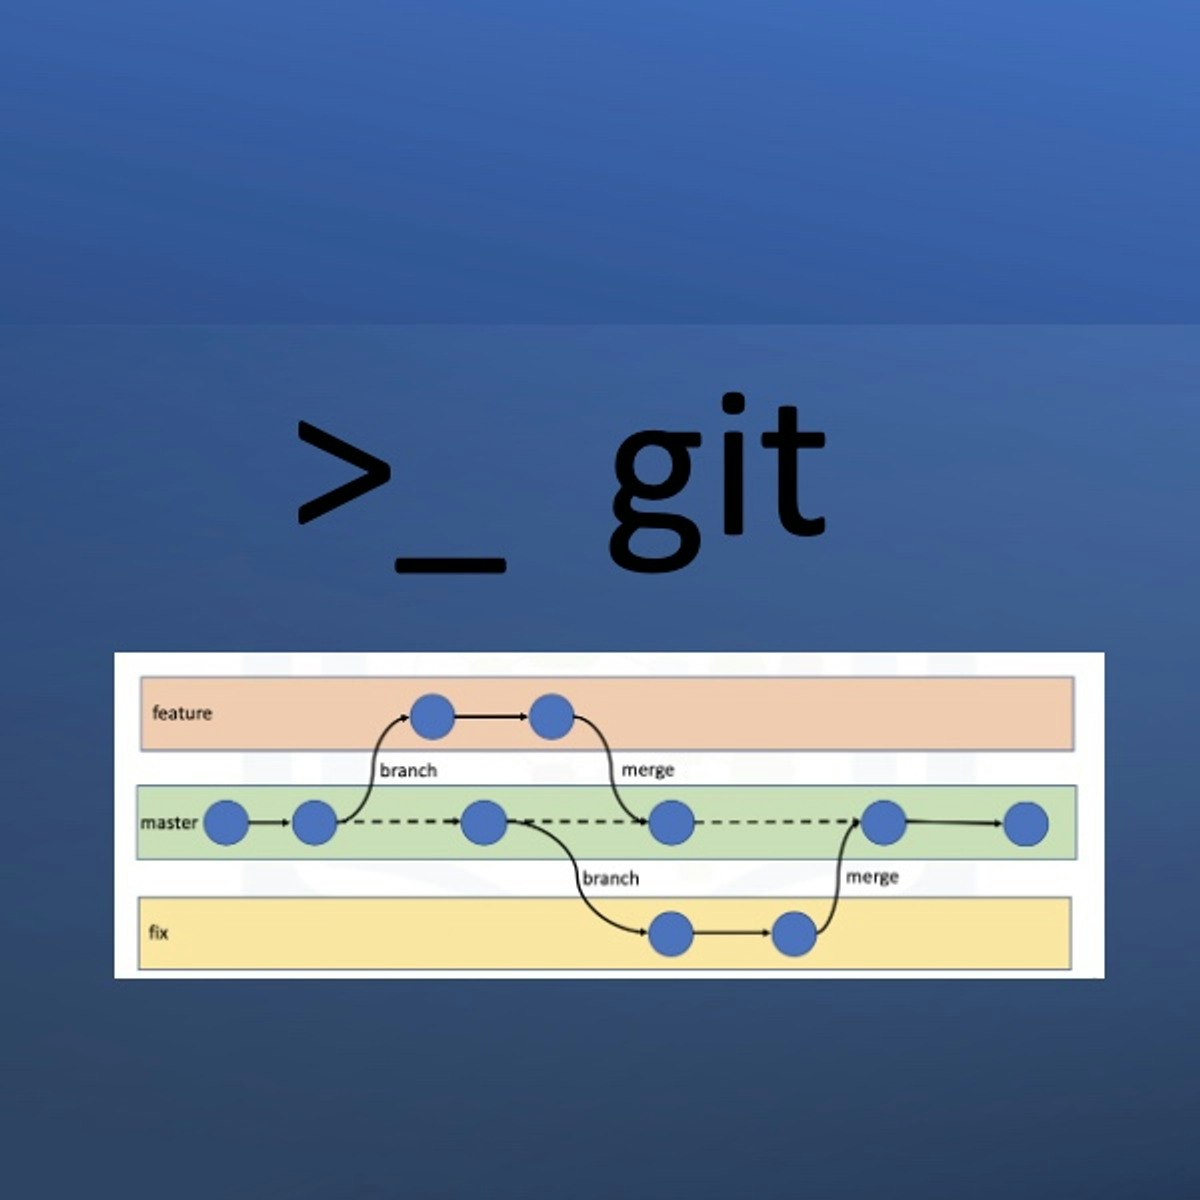


Data Science Courses - Page 127
Showing results 1261-1270 of 1407
Getting Started with Git and GitHub
Collaboration and social coding are crucial parts of contemporary Software Engineering practices and the DevOps culture. In this course, you’ll be introduced to collaborative version control and popular Git platforms.
You will explore key Git concepts such as branching and repositories, as well as the use of Git commands. You will also learn and practice various Git concepts such as forking, cloning and merging workflows. You will learn to use GitHub to work effectively as a team, and perform common Git operations, such as Pull Requests, from both the Web UI and command line.
Developed and taught by experienced IBM practitioners, in this course you’ll gain vital skills and hands-on experience using Git and GitHub. Each module contains hands-on labs for you to apply and practice what you learn. The course wraps up with a final project where you will start building your portfolio by creating and sharing a public/open-source GitHub project.
All hands-on activities in this course can be performed using web-browser based tools and interfaces. Installation of any specialized software is NOT required on your own computer in order to complete the course.
Analyzing and Visualizing Data in Looker
In this course, you learn how to do the kind of data exploration and analysis in Looker that would formerly be done primarily by SQL developers or analysts. Upon completion of this course, you will be able to leverage Looker's modern analytics platform to find and explore relevant content in your organization’s Looker instance, ask questions of your data, create new metrics as needed, and build and share visualizations and dashboards to facilitate data-driven decision making.
IBM Data Topology
Every business and organization is facing new challenges with their data. Pressures related to regulation and compliance, leveraging AI, spanning multicloud environments, and increasing volumes of inaccessible data are forcing executives and administrators to either modernize their infrastructures or become obsolete. But moving to the latest technology in a monolithic architecture is a tempting solution that can be expensive and cause more problems than it solves. In this course, you learn how to meet the needs of all your data consumers through the construction of a modern logical topology that helps you optimize data flow.
Data Analysis Using Python
This course provides an introduction to basic data science techniques using Python. Students are introduced to core concepts like Data Frames and joining data, and learn how to use data analysis libraries like pandas, numpy, and matplotlib. This course provides an overview of loading, inspecting, and querying real-world data, and how to answer basic questions about that data. Students will gain skills in data aggregation and summarization, as well as basic data visualization.
Research Data Management and Sharing
This course will provide learners with an introduction to research data management and sharing. After completing this course, learners will understand the diversity of data and their management needs across the research data lifecycle, be able to identify the components of good data management plans, and be familiar with best practices for working with data including the organization, documentation, and storage and security of data. Learners will also understand the impetus and importance of archiving and sharing data as well as how to assess the trustworthiness of repositories.
Today, an increasing number of funding agencies, journals, and other stakeholders are requiring data producers to share, archive, and plan for the management of their data. In order to respond to these requirements, researchers and information professionals will need the data management and curation knowledge and skills that support the long-term preservation, access, and reuse of data. Effectively managing data can also help optimize research outputs, increase the impact of research, and support open scientific inquiry. After completing this course, learners will be better equipped to manage data throughout the entire research data lifecycle from project planning to the end of the project when data ideally are shared and made available within a trustworthy repository.
This course was developed by the Curating Research Assets and Data Using Lifecycle Education (CRADLE) Project in collaboration with EDINA at the University of Edinburgh.
This course was made possible in part by the Institute of Museum and Library Services under award #RE-06-13-0052-13. The views, findings, conclusions or recommendations expressed in this Research Data Management and Sharing MOOC do not necessarily represent those of the Institute of Museum and Library Services.
Hashtag: #RDMSmooc
Leveraging Real-Time Analytics in Slack
By the end of this course, you will access and leverage analytics in Slack. Leveraging analytics in your Slack digital work environment will allow you to make data-driven decisions, foster a feedback culture, and define tactics that move your work group closer to its goals. You will do this by gaining hands-on experience accessing Slack’s internal analytics, reviewing external integrations and how they work in concert with them, and building an integration to the SurveyMonkey application from within Slack.
You will also have the opportunity to set up a free SurveyMonkey account to begin capturing new data from the team in your Slack workspace. Your hands-on project will include techniques that will enable you to integrate any cloud-based/outside service within your Slack environment and then leverage its functions and resources to maximize the effectiveness of collaborations and your team’s productivity through the practice of making data-driven decisions. For the purpose of this course, we will use the free-to-use, SurveyMonkey external integration and set it up from within your Slack environment.
You will work through this guided project in the Slack app on your Rhyme virtual machine, where you will use your current Slack workspace or set up a sample workspace under Slack’s free plan so that you can gain hands-on experience leveraging analytics in Slack with local and external integrations.
Note: This course works best for learners who are based in the North America region. We’re currently working on providing the same experience in other regions.
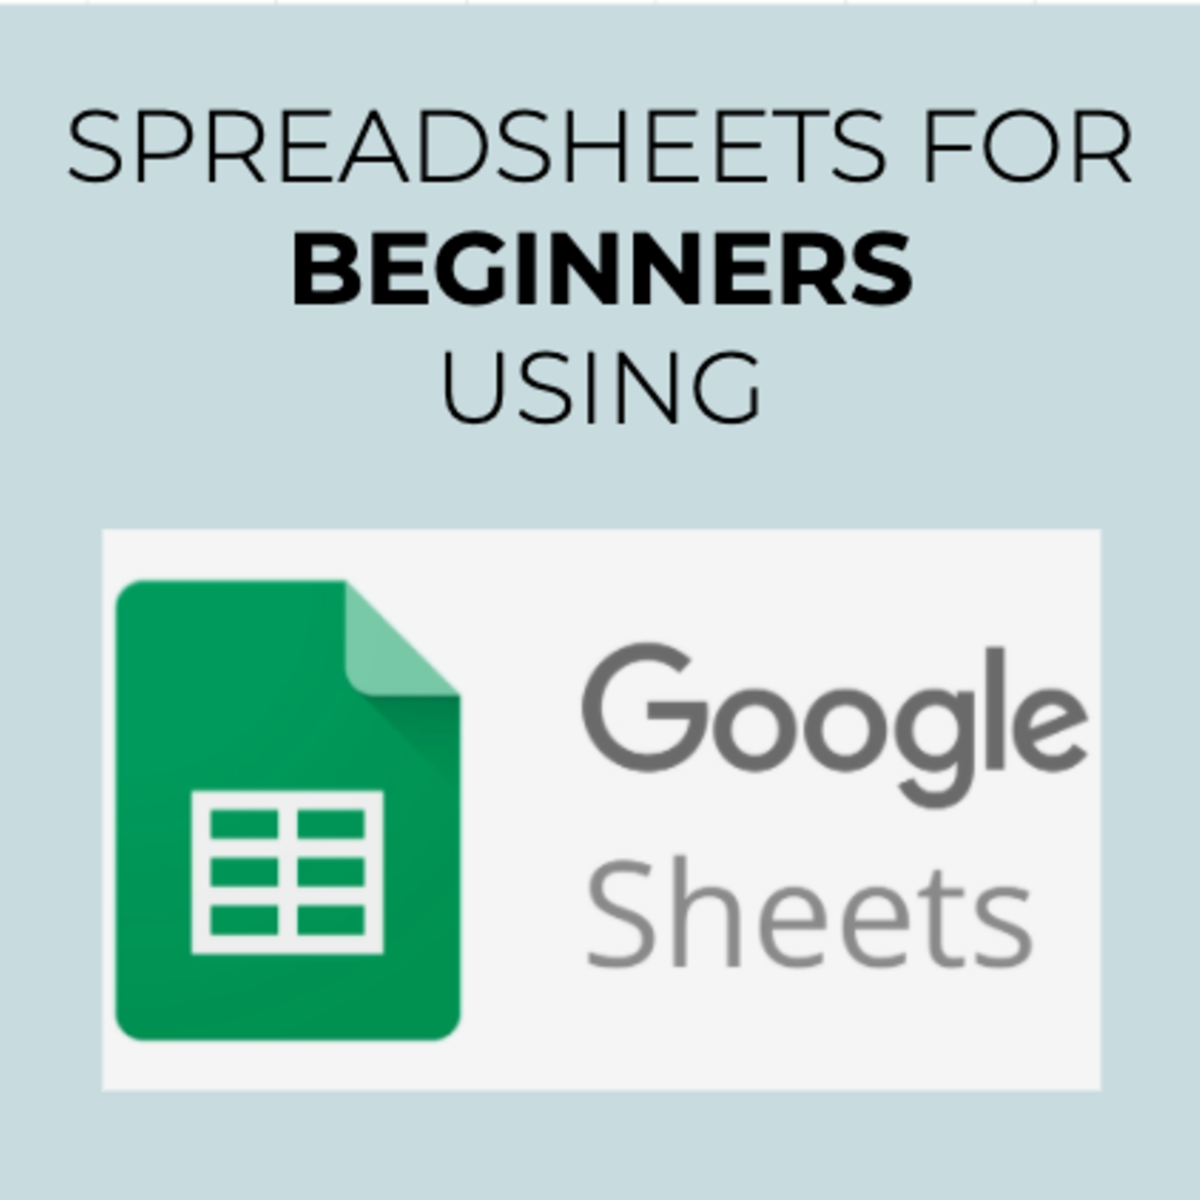
Spreadsheets for Beginners using Google Sheets
This 2-hour long project-based course is an introduction to spreadsheets. We’ll be using Google Sheets in this project, which is the free spreadsheet program offered by Google. With that said, most of the concepts that you will learn in this project will be applicable to other spreadsheet programs, such as Microsoft Excel.
We will cover the following concepts in a hands-on manner:
- Basic data entry, formatting and calculations
- Relative and absolute cell references
- Basic functions: concatenate, split, sum, average, median, min, max, count, counta
- Advanced functions: vlookup, if, and, or, iferror, countif, countifs, averageif, averageifs, sumif, sumifs
- Dealing with error messages
- Conditional formatting
- Filtering and sorting
- Basic charts to visualize our data
We will end the project by applying these concepts and create a basic spreadsheet model that helps us analyze household expenses.
Note: If you don't have a Google account, you will need to create one to be able to complete the content.
IBM Data Analyst Capstone Project
In this course you will apply various Data Analytics skills and techniques that you have learned as part of the previous courses in the IBM Data Analyst Professional Certificate. You will assume the role of an Associate Data Analyst who has recently joined the organization and be presented with a business challenge that requires data analysis to be performed on real-world datasets.
You will undertake the tasks of collecting data from multiple sources, performing exploratory data analysis, data wrangling and preparation, statistical analysis and mining the data, creating charts and plots to visualize data, and building an interactive dashboard. The project will culminate with a presentation of your data analysis report, with an executive summary for the various stakeholders in the organization. You will be assessed on both your work for the various stages in the Data Analysis process, as well as the final deliverable.
This project is a great opportunity to showcase your Data Analytics skills, and demonstrate your proficiency to potential employers.
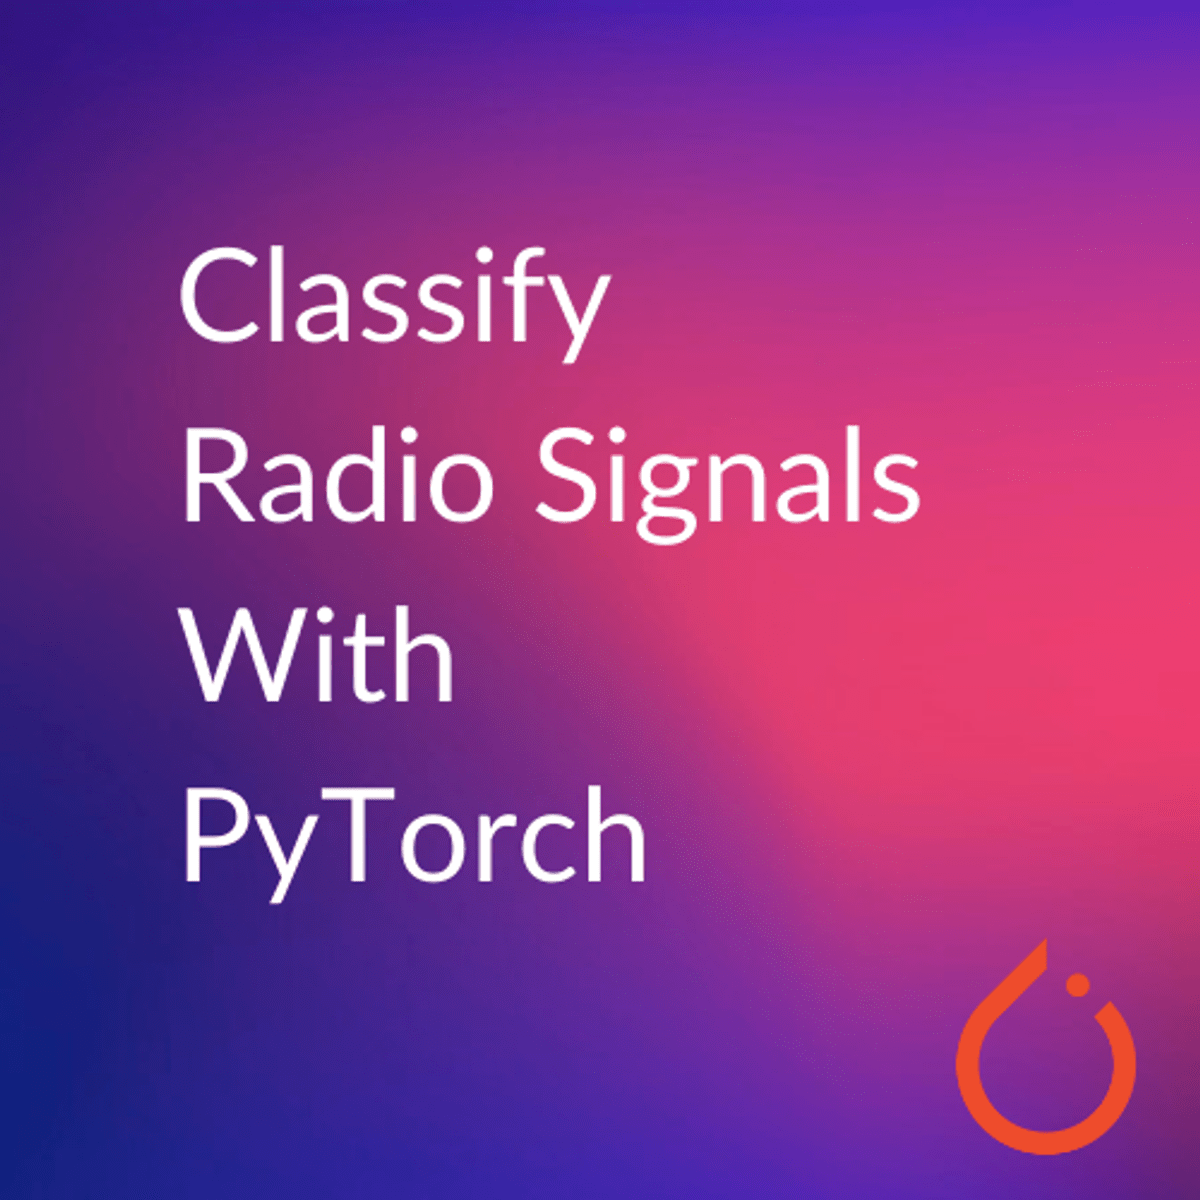
Classify Radio Signals with PyTorch
In this 2-hour long guided-project course, you will load a pretrained state of the art model CNN and you will train in PyTorch to classify radio signals with input as spectogram images. The data that you will use, consists of spectogram images (spectogram is a representation of audio signals) and there are targets such as ( Squiggle, Noises, Narrowband, etc). Furthermore, you will apply spectogram augmentation for classification task to augment spectogram images. Moreover, you are going to create train and evaluator function which will be helpful to write training loop. Lastly, you will use best trained model to classify radio signals given any 2D Spectogram of radio signal input images.
Google Cloud Pub/Sub: Qwik Start - Console
This is a self-paced lab that takes place in the Google Cloud console. This hands-on lab shows you how to publish and consume messages with a pull subscriber, using the Google Cloud Platform Console. Watch the short video Simplify Event Driven Processing with Cloud Pub/Sub.