Back to Courses







Data Science Courses - Page 121
Showing results 1201-1210 of 1407

Statistics for Genomic Data Science
An introduction to the statistics behind the most popular genomic data science projects. This is the sixth course in the Genomic Big Data Science Specialization from Johns Hopkins University.

Data Mining Project
Note: You should complete all the other courses in this Specialization before beginning this course.
This six-week long Project course of the Data Mining Specialization will allow you to apply the learned algorithms and techniques for data mining from the previous courses in the Specialization, including Pattern Discovery, Clustering, Text Retrieval, Text Mining, and Visualization, to solve interesting real-world data mining challenges. Specifically, you will work on a restaurant review data set from Yelp and use all the knowledge and skills you’ve learned from the previous courses to mine this data set to discover interesting and useful knowledge. The design of the Project emphasizes: 1) simulating the workflow of a data miner in a real job setting; 2) integrating different mining techniques covered in multiple individual courses; 3) experimenting with different ways to solve a problem to deepen your understanding of techniques; and 4) allowing you to propose and explore your own ideas creatively.
The goal of the Project is to analyze and mine a large Yelp review data set to discover useful knowledge to help people make decisions in dining. The project will include the following outputs:
1. Opinion visualization: explore and visualize the review content to understand what people have said in those reviews.
2. Cuisine map construction: mine the data set to understand the landscape of different types of cuisines and their similarities.
3. Discovery of popular dishes for a cuisine: mine the data set to discover the common/popular dishes of a particular cuisine.
4. Recommendation of restaurants to help people decide where to dine: mine the data set to rank restaurants for a specific dish and predict the hygiene condition of a restaurant.
From the perspective of users, a cuisine map can help them understand what cuisines are there and see the big picture of all kinds of cuisines and their relations. Once they decide what cuisine to try, they would be interested in knowing what the popular dishes of that cuisine are and decide what dishes to have. Finally, they will need to choose a restaurant. Thus, recommending restaurants based on a particular dish would be useful. Moreover, predicting the hygiene condition of a restaurant would also be helpful.
By working on these tasks, you will gain experience with a typical workflow in data mining that includes data preprocessing, data exploration, data analysis, improvement of analysis methods, and presentation of results. You will have an opportunity to combine multiple algorithms from different courses to complete a relatively complicated mining task and experiment with different ways to solve a problem to understand the best way to solve it. We will suggest specific approaches, but you are highly encouraged to explore your own ideas since open exploration is, by design, a goal of the Project.
You are required to submit a brief report for each of the tasks for peer grading. A final consolidated report is also required, which will be peer-graded.

Artificial Intelligence: Ethics & Societal Challenges
Artificial Intelligence: Ethics & Societal Challenges is a four-week course that explores ethical and societal aspects of the increasing use of artificial intelligent technologies (AI). The aim of the course is to raise awareness of ethical and societal aspects of AI and to stimulate reflection and discussion upon implications of the use of AI in society.
The course consists of four modules where each module represents about one week of part-time studies. A module includes a number of lectures and readings. Each lesson finishes with a mandatory assignment in which you write a short sum-up of the most important new knowledge/insight you gained from this lesson, and review a lesson sum-up written by another student/participant. The assessments are intended to encourage learning and to stimulate reflection on ethical and societal issues of the use of AI in society. Participating in forum discussions is voluntary but strongly encouraged.
In the first module, we will discuss algorithmic bias and surveillance. Is it really true that algorithms are purely logical and free from human biases or are they maybe just as biased as we are, and if they are, why is that and what can we do about it? AI in many ways makes surveillance more effective, but what does it mean to us if we are increasingly being watched in more and more sophisticated ways?
Next, we will talk about the impact of AI on democracy. We discuss why democracy is important, and how AI could hamper public democratic discussion, but also how it can help improve democracy. We will for instance talk about how social media could play in the hands of authoritarian regimes and present some ideas on how to make use of AI tools to develop the functioning of democracy.
A further ethical question concerns whether our treatment of AI could matter for the AIs themselves. Can artefacts be conscious? What do we even mean by “conscious”? What is the relationship between consciousness and intelligence? This is the topic of the third week of the course.
In the last module we will talk about responsibility and control. If an autonomous car hits an autonomous robot, who is responsible? And who is responsible to make sure AI is developed in a safe and democratic way?
The last question of the course, and maybe also the ultimate question for our species, is how to control machines that are more intelligent than we are. Our intelligence has given us a lot of power over the world we live in. Shall we really give that power away to machines and if we do, how do we stay in charge?
At the end of the course, you will have
· a basic understanding of the AI bias phenomenon and the role of AI in surveillance,
· a basic understanding of the importance of democracy in relation to AI and acquaintance with common issues with democracy in relation to AI,
· an understanding of the complexity of the concepts ‘intelligence’ and ‘consciousness’ and acquaintance with common approaches to creating artificial consciousness,
· a basic understanding of the concepts of ‘forward-looking’ and ‘backward-looking responsibility’ and an acquaintance with problems connected to applying these concepts on AI,
· a basic understanding of the control problem in AI and acquaintance with commonly discussed solutions to this problem,
· and an ability to discuss and reflect upon the ethical and societal aspects of these issues.

Python Project for Data Science
This mini-course is intended to for you to demonstrate foundational Python skills for working with data. The completion of this course involves working on a hands-on project where you will develop a simple dashboard using Python.
This course is part of the IBM Data Science Professional Certificate and the IBM Data Analytics Professional Certificate.
PRE-REQUISITE: **Python for Data Science, AI and Development** course from IBM is a pre-requisite for this project course. Please ensure that before taking this course you have either completed the Python for Data Science, AI and Development course from IBM or have equivalent proficiency in working with Python and data.
NOTE: This course is not intended to teach you Python and does not have too much instructional content. It is intended for you to apply prior Python knowledge.

Build a Regression Model using PyCaret
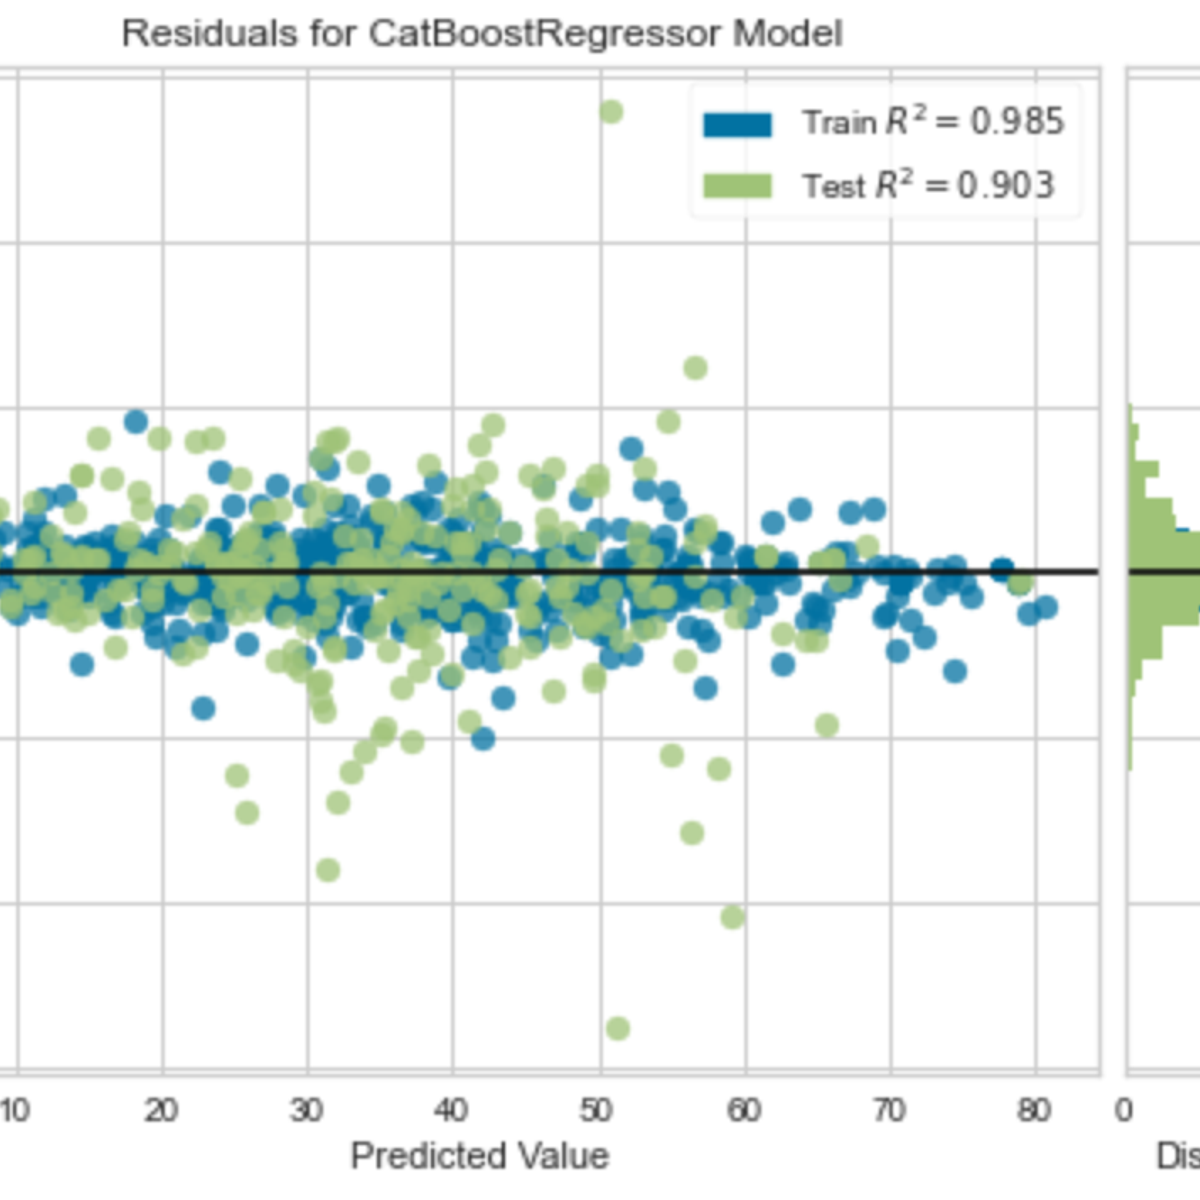
In this 1-hour long project-based course, you will create an end-to-end Regression model using PyCaret a low-code Python open-source Machine Learning library.
The goal is to build a model that can accurately predict the strength of concrete based on several fatures.
You will learn how to automate the major steps for building, evaluating, comparing and interpreting Machine Learning Models for regression.
Here are the main steps you will go through: frame the problem, get and prepare the data, discover and visualize the data, create the transformation pipeline, build, evaluate, interpret and deploy the model.
This guided project is for seasoned Data Scientists who want to build a accelerate the efficiency in building POC and experiments by using a low-code library. It is also for Citizen data Scientists (professionals working with data) by using the low-code library PyCaret to add machine learning models to the analytics toolkit
In order to be successful in this project, you should be familiar with Python and the basic concepts on Machine Learning
Note: This course works best for learners who are based in the North America region. We’re currently working on providing the same experience in other regions.

Introduction to Applied Machine Learning
This course is for professionals who have heard the buzz around machine learning and want to apply machine learning to data analysis and automation. Whether finance, medicine, engineering, business or other domains, this course will introduce you to problem definition and data preparation in a machine learning project.
By the end of the course, you will be able to clearly define a machine learning problem using two approaches. You will learn to survey available data resources and identify potential ML applications. You will learn to take a business need and turn it into a machine learning application. You will prepare data for effective machine learning applications.
This is the first course of the Applied Machine Learning Specialization brought to you by Coursera and the Alberta Machine Intelligence Institute.

Tesla Stock Price Prediction using Facebook Prophet
In this 1.5-hour long project-based course, you will learn how to build a Facebook Prophet Machine learning model in order to forecast the price of Tesla 30 days into the future. We will also visualize the historical performance of Tesla through graphs and charts using Plotly express and evaluate the performance of the model against real data using Google Finance in Google Sheets. We will also dive into a brief stock analysis of Tesla and we will discuss PE ratio, EPS, Beta, Market cap, Volume and price range of Tesla. We will end the project by automating the forecasting process in such a way that you will get the forecast of any of your favourite stock with all necessary visualization within a few seconds of uploading the data. By the end of this project, you will be confident in analyzing, visualizing and forecasting the price of any stock of your choice.
Disclaimer: This project is intended for educational purpose only and is by no means a piece of Financial advice. Please consult your financial advisor before investing in stocks.
Note: This course works best for learners who are based in the North America region. We’re currently working on providing the same experience in other regions.
Structured Query Language (SQL) using SAS
Course Description
In this course, you learn about Structured Query Language (SQL) and how it can be used in SAS programs to create reports and query your data.
“By the end of this course, a learner will be able to…”
● Query and subset data.
● Summarize and present data.
● Combine tables using joins and set operators.
● Create and modify tables and views.
● Create data-driven macro variables using a query.
● Access DBMS data with SAS/ACCESS technology.

Building Candlestick Charts with Tableau
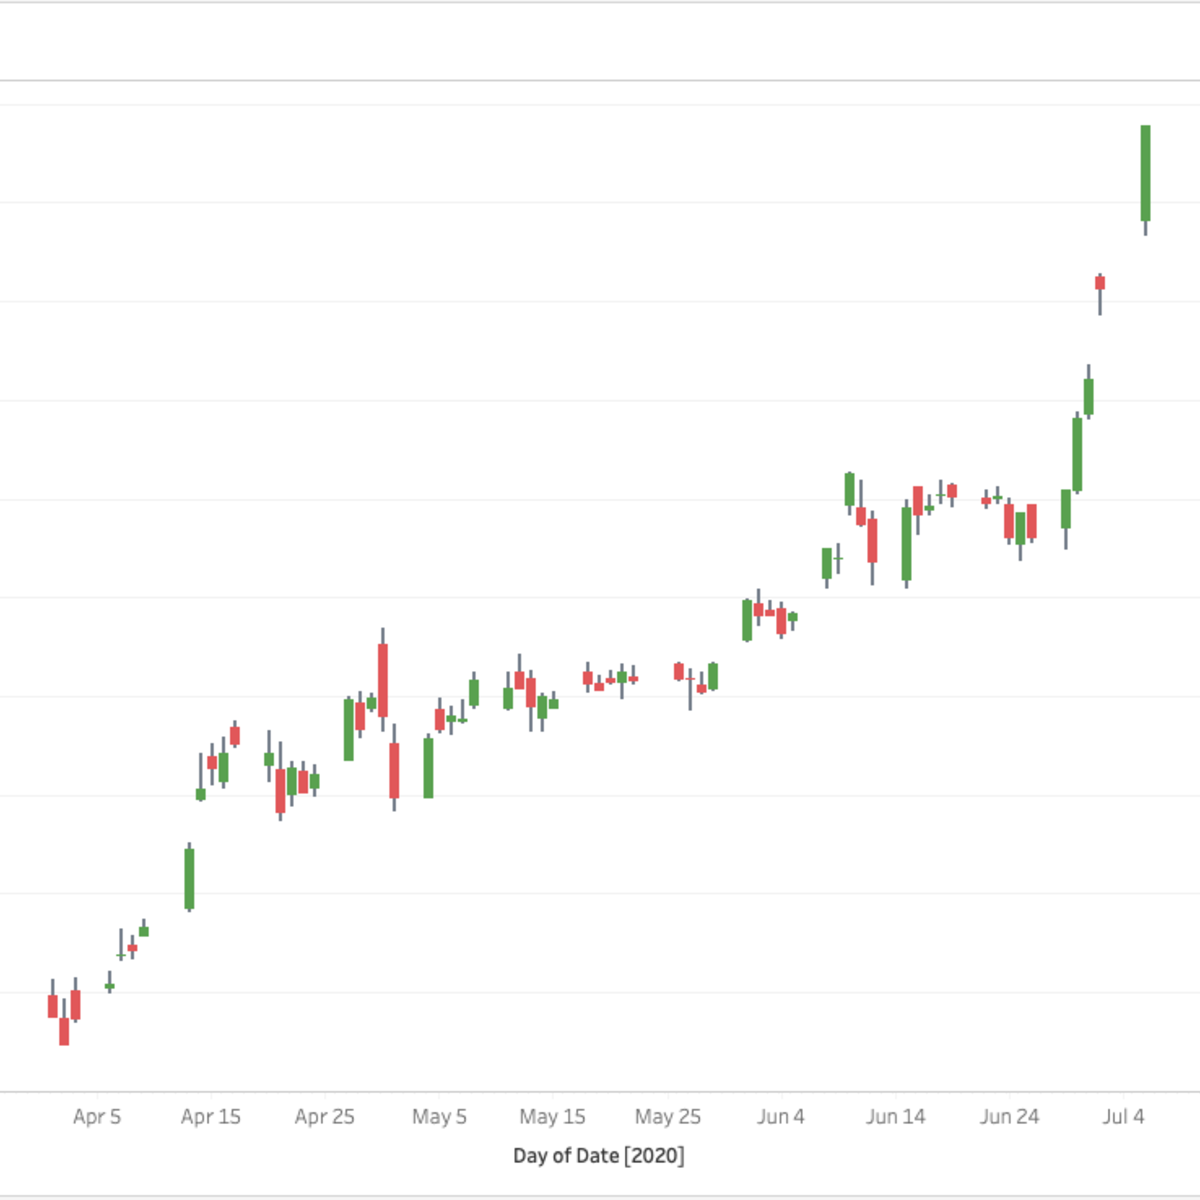
In this 1-hour long project-based course, you will learn how to use Python YFinance to extract stock price data and how to use Tableau to build a japanese candlestick chart.
Note: This course works best for learners who are based in the North America region. We're currently working on providing the same experience in other regions.
This course's content is not intended to be investment advice and does not constitute an offer to perform any operations in the regulated or unregulated financial market

Analyze Sales Data with LibreOffice Base Queries
By the end of this project, you will have developed LibreOffice Base queries that provide data for use in sales analysis. An organization that sells products or services finds it useful to know which products are selling, whether they are priced appropriately, and which customers are purchasing them. Providing that kind of data gives the organization better targets for fine tuning its product mix and customer base.
Note: This course works best for learners who are based in the North America region. We’re currently working on providing the same experience in other regions.
Popular Internships and Jobs by Categories
Browse
© 2024 BoostGrad | All rights reserved


