Back to Courses
Building Candlestick Charts with Tableau
Overview
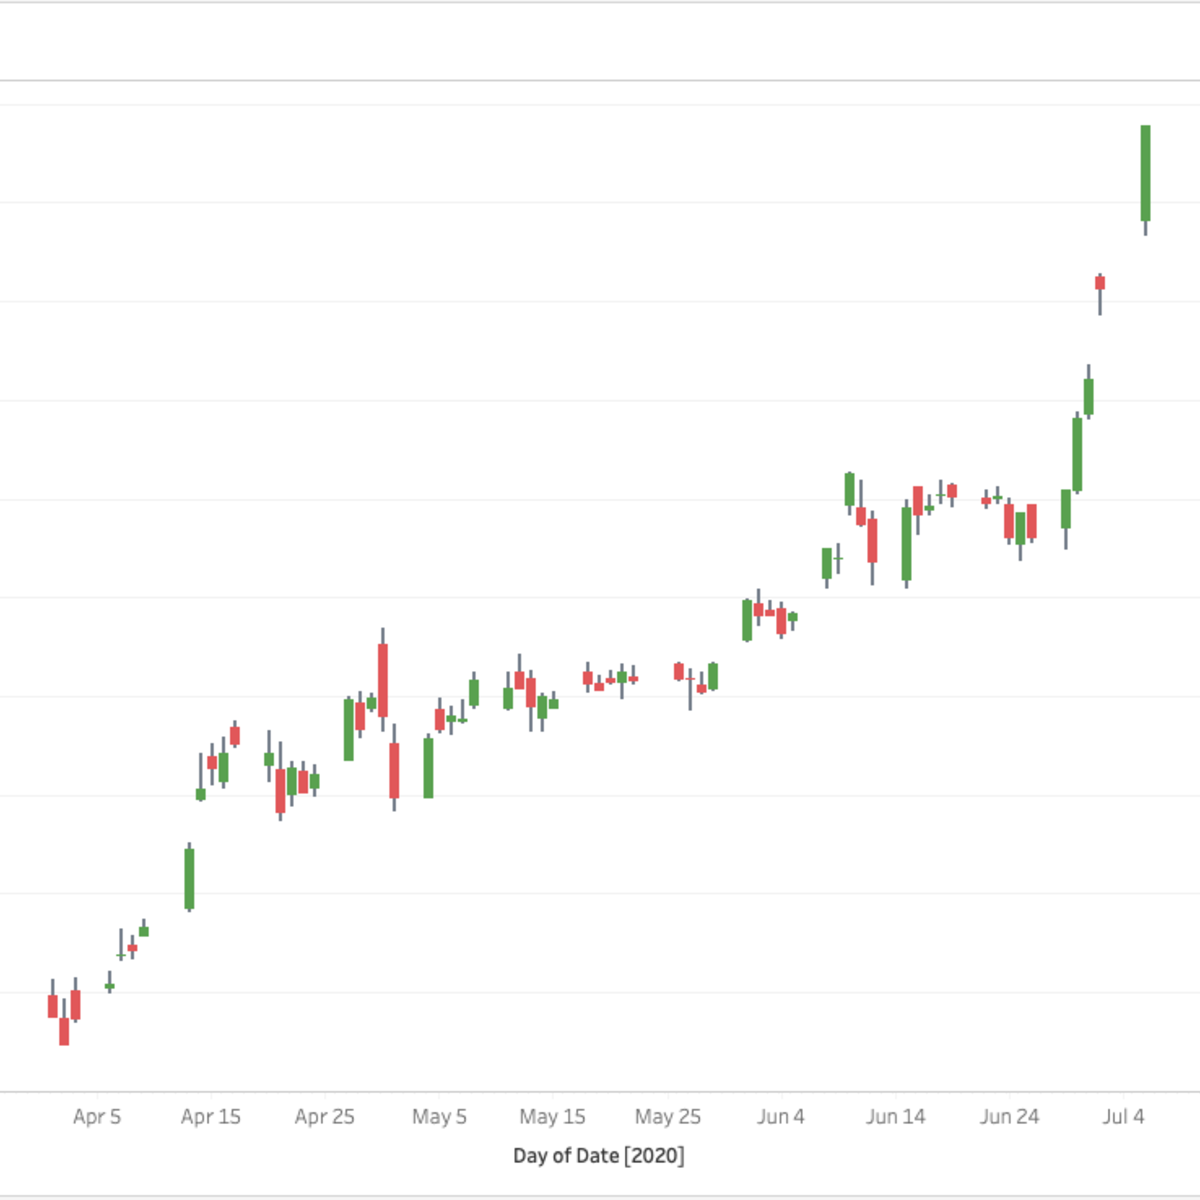
In this 1-hour long project-based course, you will learn how to use Python YFinance to extract stock price data and how to use Tableau to build a japanese candlestick chart. Note: This course works best for learners who are based in the North America region. We're currently working on providing the same experience in other regions. This course's content is not intended to be investment advice and does not constitute an offer to perform any operations in the regulated or unregulated financial market
Your dream job is just a tap away — only on the BoostGrad app.

View on Boostgrad App
View on Browser
Continue
Download the app