
Back to Courses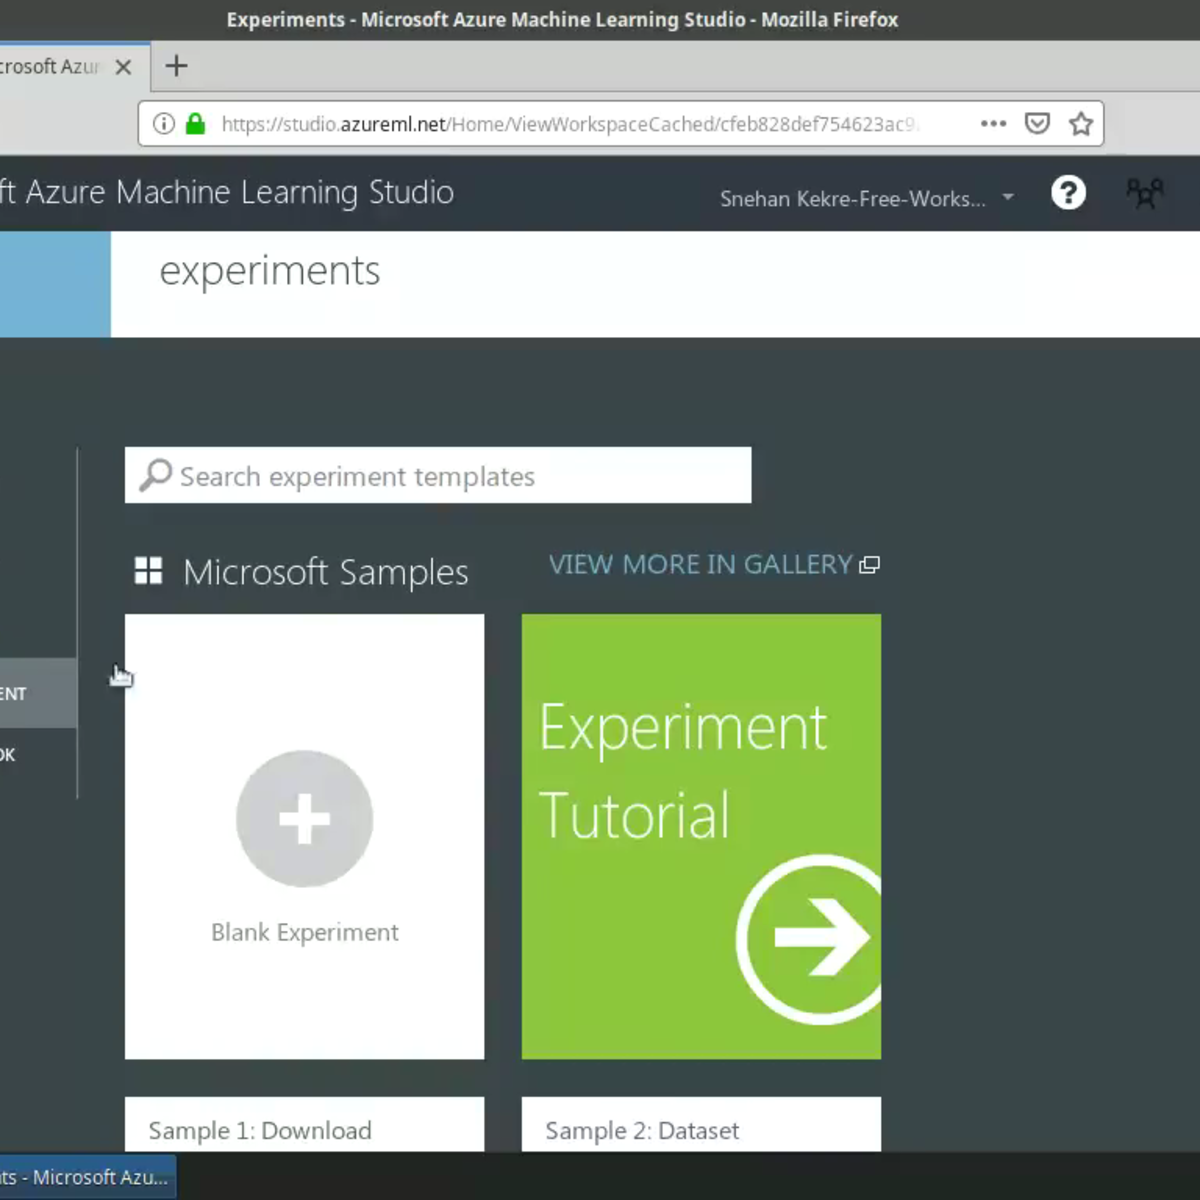


Data Science Courses - Page 122
Showing results 1211-1220 of 1407
Deep Learning Inference with Azure ML Studio
In this project-based course, you will use the Multiclass Neural Network module in Azure Machine Learning Studio to train a neural network to recognize handwritten digits. Microsoft Azure Machine Learning Studio is a drag-and-drop tool you can use to rapidly build and deploy machine learning models on Azure. The data used in this course is the popular MNIST data set consisting of 70,000 grayscale images of hand-written digits. You are going to deploy the trained neural network model as an Azure Web service. Azure Web Services provide an interface between an application and a Machine Learning Studio workflow scoring model. You will write a Python application to use the Batch Execution Service and predict the class labels of handwritten digits.
This is the third course in this series on building machine learning applications using Azure Machine Learning Studio. I highly encourage you to take the first course before proceeding. It has instructions on how to set up your Azure ML account with $200 worth of free credit to get started with running your experiments!
This course runs on Coursera's hands-on project platform called Rhyme. On Rhyme, you do projects in a hands-on manner in your browser. You will get instant access to pre-configured cloud desktops containing all of the software and data you need for the project. Everything is already set up directly in your internet browser so you can just focus on learning. For this project, you’ll get instant access to a cloud desktop with Python, Jupyter, and scikit-learn pre-installed.
Notes:
- You will be able to access the cloud desktop 5 times. However, you will be able to access instructions videos as many times as you want.
- This course works best for learners who are based in the North America region. We’re currently working on providing the same experience in other regions.
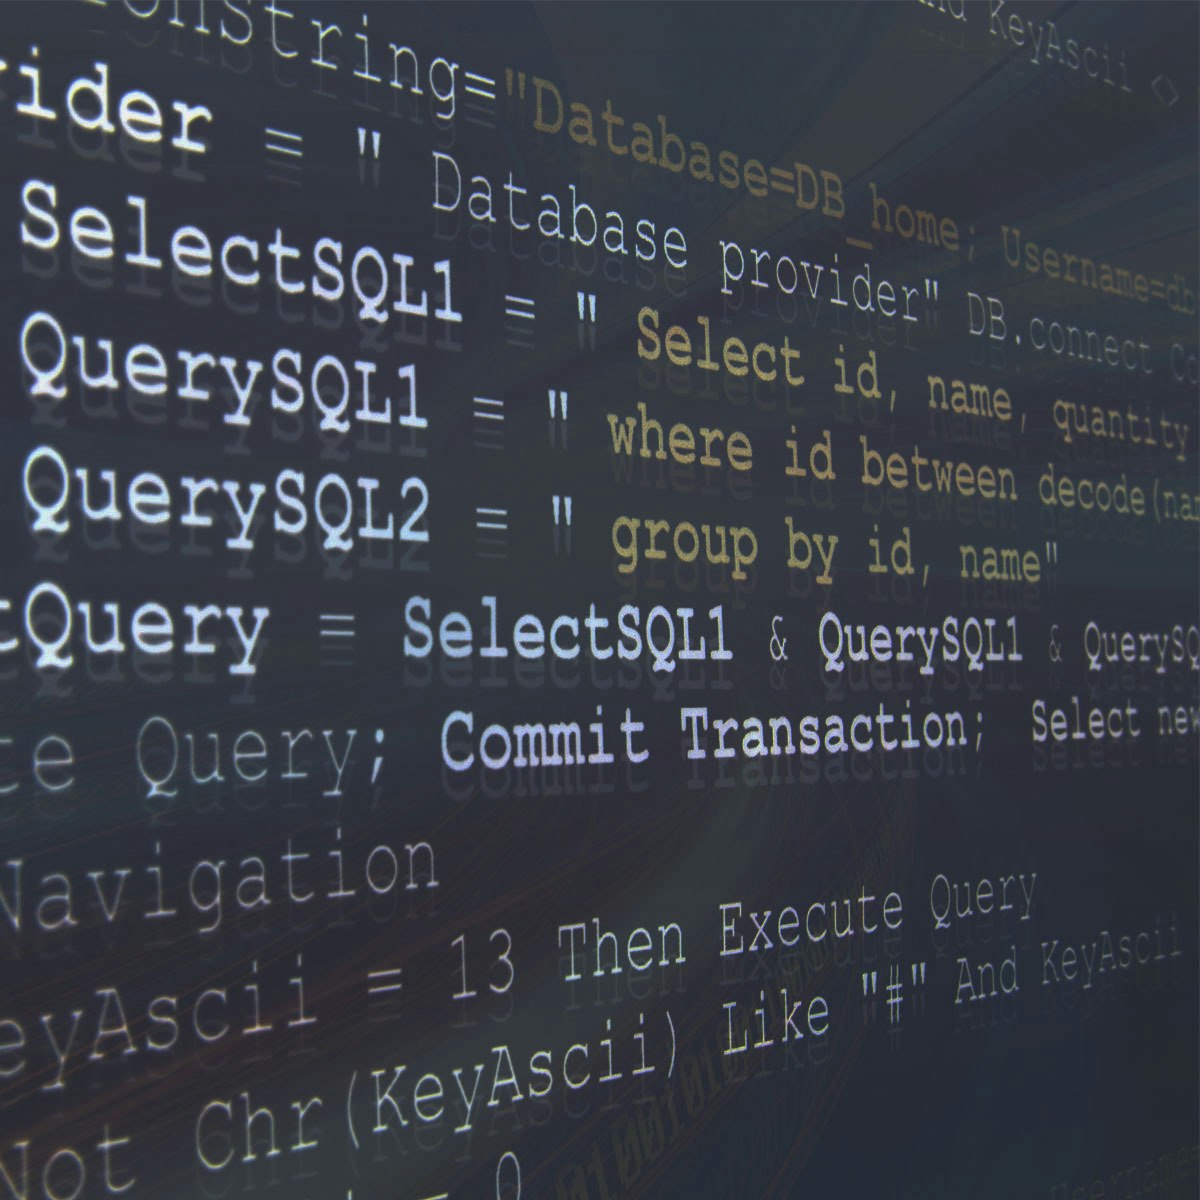
SQL for Data Science
As data collection has increased exponentially, so has the need for people skilled at using and interacting with data; to be able to think critically, and provide insights to make better decisions and optimize their businesses. This is a data scientist, “part mathematician, part computer scientist, and part trend spotter” (SAS Institute, Inc.). According to Glassdoor, being a data scientist is the best job in America; with a median base salary of $110,000 and thousands of job openings at a time. The skills necessary to be a good data scientist include being able to retrieve and work with data, and to do that you need to be well versed in SQL, the standard language for communicating with database systems.
This course is designed to give you a primer in the fundamentals of SQL and working with data so that you can begin analyzing it for data science purposes. You will begin to ask the right questions and come up with good answers to deliver valuable insights for your organization. This course starts with the basics and assumes you do not have any knowledge or skills in SQL. It will build on that foundation and gradually have you write both simple and complex queries to help you select data from tables. You'll start to work with different types of data like strings and numbers and discuss methods to filter and pare down your results.
You will create new tables and be able to move data into them. You will learn common operators and how to combine the data. You will use case statements and concepts like data governance and profiling. You will discuss topics on data, and practice using real-world programming assignments. You will interpret the structure, meaning, and relationships in source data and use SQL as a professional to shape your data for targeted analysis purposes.
Although we do not have any specific prerequisites or software requirements to take this course, a simple text editor is recommended for the final project. So what are you waiting for? This is your first step in landing a job in the best occupation in the US and soon the world!
Tools and Practices for Addressing Pandemic Challenges
An overview of the tools, techniques, and practices that can be enacted by policy makers, countries, and organizations to monitor, manage, and react to pandemics and mitigate and govern their impacts.
An introductory, multidisciplinary course covering data science, social science, healthcare, and management, paving the way to various courses on specific matters.
This course is part of the research project 'Pan-European Response to the Impacts of the COVID-19 and future Pandemics and Epidemics' (PERISCOPE, https://www.periscopeproject.eu/). Funded by the European Commission Research Funding programme Horizon 2020 under the Grant Agreement number 101016233, PERISCOPE investigates the broad socio-economic and behavioural impacts of the COVID-19 pandemic, to make Europe more resilient and prepared for future large-scale risks.
Charts, Pictures, Themes, and Styles in Microsoft Excel
By the end of this project, you will create a free account on Microsoft 365, get access to Microsoft Excel, and will create a workbook with charts, pictures, themes, and styles. Your new skills will help you manage information in Microsoft Excel in the most efficient way.
Data Visualization with R
In this course, you will learn the Grammar of Graphics, a system for describing and building graphs, and how the ggplot2 data visualization package for R applies this concept to basic bar charts, histograms, pie charts, scatter plots, line plots, and box plots. You will also learn how to further customize your charts and plots using themes and other techniques. You will then learn how to use another data visualization package for R called Leaflet to create map plots, a unique way to plot data based on geolocation data. Finally, you will be introduced to creating interactive dashboards using the R Shiny package. You will learn how to create and customize Shiny apps, alter the appearance of the apps by adding HTML and image components, and deploy your interactive data apps on the web.
You will practice what you learn and build hands-on experience by completing labs in each module and a final project at the end of the course.
Watch the videos, work through the labs, and watch your data science skill grow. Good luck!
NOTE: This course requires knowledge of working with R and data. If you do not have these skills, it is highly recommended that you first take the Introduction to R Programming for Data Science as well as the Data Analysis with R courses from IBM prior to starting this course. Note: The pre-requisite for this course is basic R programming skills.
NoSQL systems
Welcome to the specialization course of NoSQL Systems.
This course will be completed on six weeks, it will be supported with videos and exercises that will allow you to identify the differences between the relational and NoSQL databases.
As part of these alternative technologies the student will learn the main characteristics and how to implement the typical NoSQL databases, such as Key-value, columnar, document and graph.
Let's start!
After completing this course, a learner will be able to
● Identify what type of NoSQL database to implement based on business requirements (key-value, document, full text, graph, etc.)
● Apply NoSQL data modeling from application specific queries
● Use Atomic Aggregates and denormalization as data modelling techniques to optimize query processing
Software to download:
MongoDB
Neo4j
SAPIQ
Cassandra
In case you have a Mac / IOS operating system you will need to use a virtual Machine (VirtualBox, Vmware).
Data Visualization with Tableau Project
In this project-based course, you will follow your own interests to create a portfolio worthy single-frame viz or multi-frame data story that will be shared on Tableau Public. You will use all the skills taught in this Specialization to complete this project step-by-step, with guidance from your instructors along the way. You will first create a project proposal to identify your goals for the project, including the question you wish to answer or explore with data. You will then find data that will provide the information you are seeking. You will then import that data into Tableau and prepare it for analysis. Next you will create a dashboard that will allow you to explore the data in depth and identify meaningful insights. You will then give structure to your data story by writing the story arc in narrative form. Finally, you will consult your design checklist to craft the final viz or data story in Tableau. This is your opportunity to show the world what you’re capable of - so think big, and have confidence in your skills!
Data Science in Stratified Healthcare and Precision Medicine
An increasing volume of data is becoming available in biomedicine and healthcare, from genomic data, to electronic patient records and data collected by wearable devices. Recent advances in data science are transforming the life sciences, leading to precision medicine and stratified healthcare.
In this course, you will learn about some of the different types of data and computational methods involved in stratified healthcare and precision medicine. You will have a hands-on experience of working with such data. And you will learn from leaders in the field about successful case studies.
Topics include: (i) Sequence Processing, (ii) Image Analysis, (iii) Network Modelling, (iv) Probabilistic Modelling, (v) Machine Learning, (vi) Natural Language Processing, (vii) Process Modelling and (viii) Graph Data.
Watch the course promo video here: http://edin.ac/2pn350P
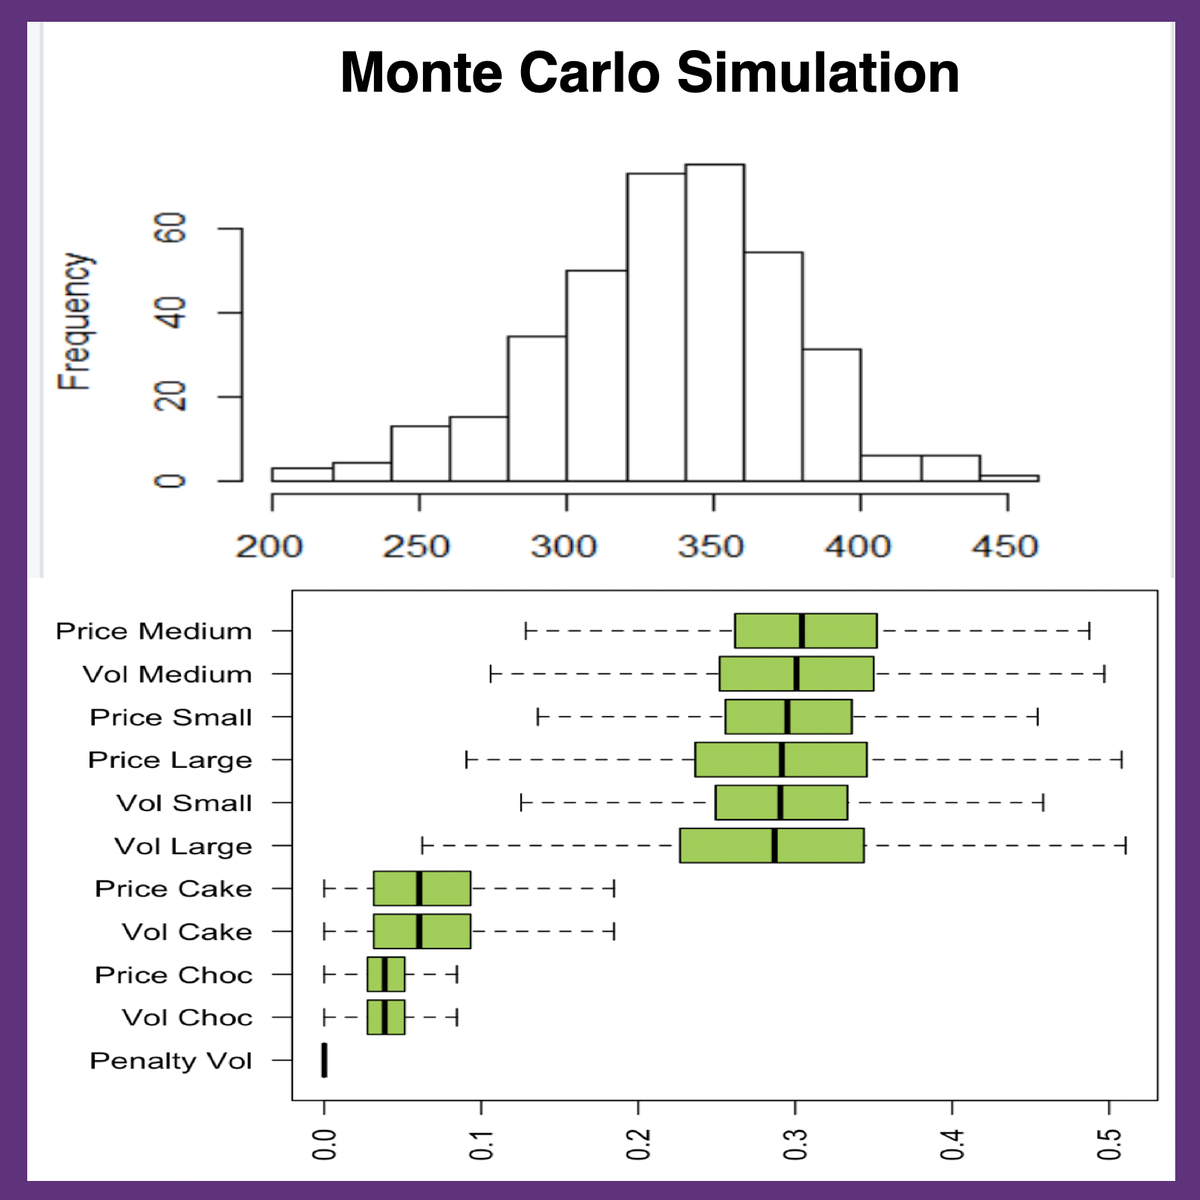
RStudio for Six Sigma - Monte Carlo Simulation
In this 2-hour long project-based course, you will learn how to
1. Generate Continuous, Discrete and Categorical Data (Xs) Using Statistical Distributions
2. Create A Transfer Function That Relates The Xs With The Y (Dependent Variable)
3. Perform Monte Carlo Simulation & Sensitivity Analysis Using RStudio
Note: This course works best for learners who are based in the North America region. We’re currently working on providing the same experience in other regions.
TensorFlow for AI: Neural Network Representation
This guided project course is part of the "Tensorflow for AI" series, and this series presents material that builds on the first course of DeepLearning.AI TensorFlow Developer Professional Certificate, which will help learners reinforce their skills and build more projects with Tensorflow.
In this 1.5-hour long project-based course, you will learn practically how to work on a deep learning task in the real world and create, train, and test a neural network with Tensorflow using real-world images, and you will get a bonus deep learning exercise implemented with Tensorflow. By the end of this project, you will have created a deep neural network with TensorFlow on a real-world dataset.
This class is for learners who want to use Python for building neural networks with TensorFlow, and for learners who are currently taking a basic deep learning course or have already finished a deep learning course and are searching for a practical deep learning project with TensorFlow project. Also, this project provides learners with further knowledge about creating and training convolutional neural networks and improves their skills in Tensorflow which helps them in fulfilling their career goals by adding this project to their portfolios.
Popular Internships and Jobs by Categories
Browse
© 2024 BoostGrad | All rights reserved