
Back to Courses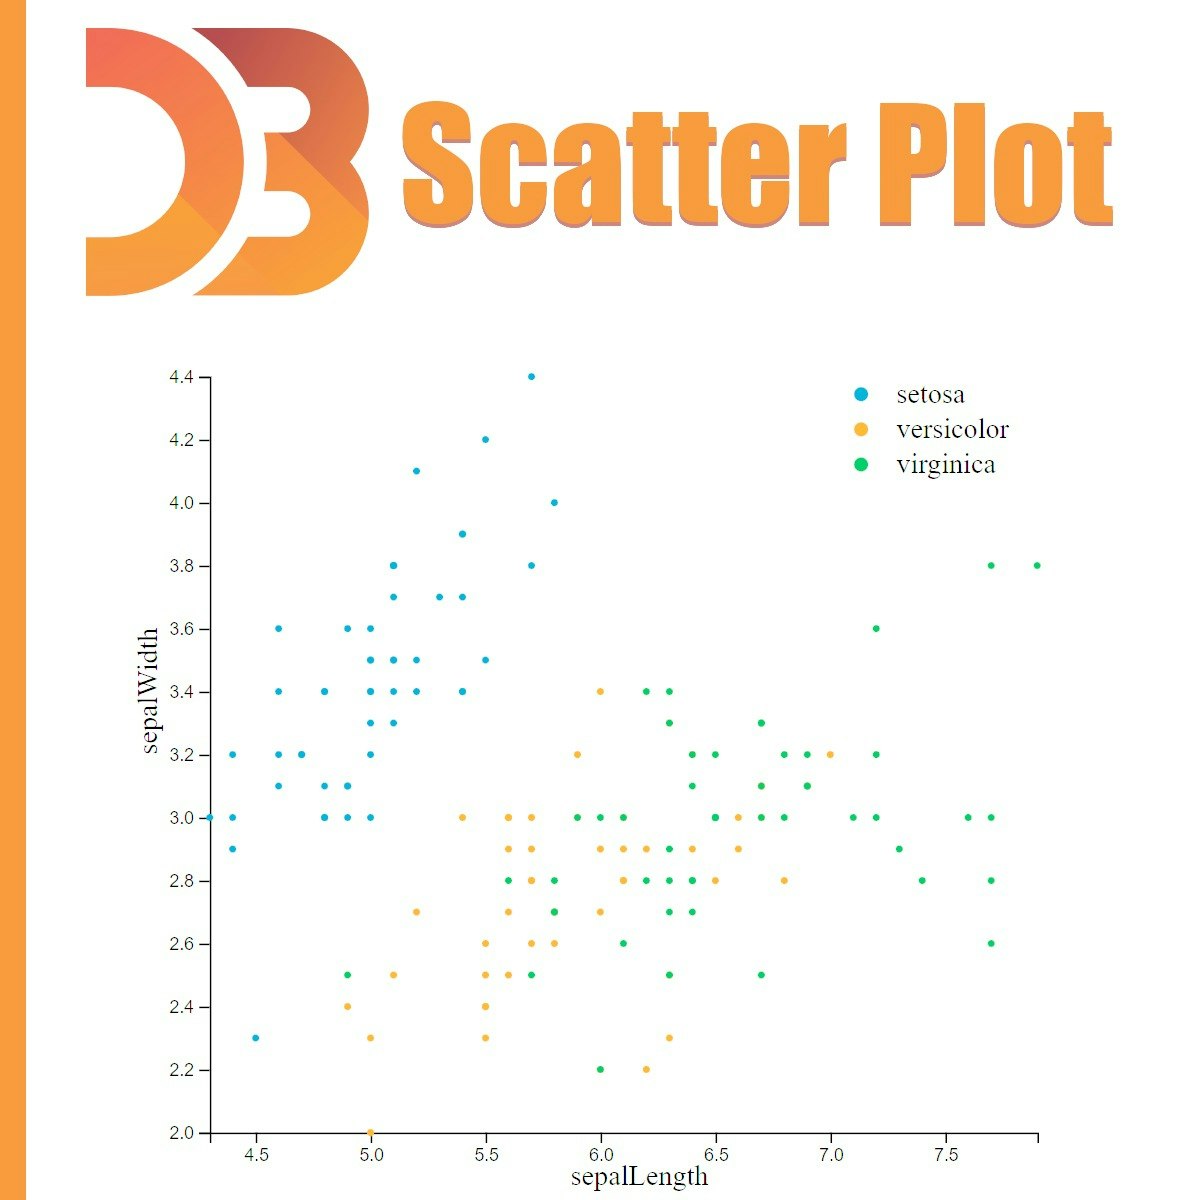


Data Science Courses - Page 116
Showing results 1151-1160 of 1407
A Simple Scatter Plot using D3 js
During this guided project, you will create a simple scatter plot using D3 js. Starting from loading our dataset we are going to cover some steps in order to create a fully functional scatter plot. We will also cover some important topics in data visualization such as Linear and Ordinal scaling to best visualize our data. Having the knowledge of javascript programming language and the basics of d3 js are the two most important prerequisites to get the most out of this guided project.
Introduction to Clinical Data
This course introduces you to a framework for successful and ethical medical data mining. We will explore the variety of clinical data collected during the delivery of healthcare. You will learn to construct analysis-ready datasets and apply computational procedures to answer clinical questions. We will also explore issues of fairness and bias that may arise when we leverage healthcare data to make decisions about patient care.
The Stanford University School of Medicine is accredited by the Accreditation Council for Continuing Medical Education (ACCME) to provide continuing medical education for physicians. Visit the FAQs below for important information regarding 1) Date of original release and Termination or expiration date; 2) Accreditation and Credit Designation statements; 3) Disclosure of financial relationships for every person in control of activity content.
Capstone: Retrieving, Processing, and Visualizing Data with Python
In the capstone, students will build a series of applications to retrieve, process and visualize data using Python. The projects will involve all the elements of the specialization. In the first part of the capstone, students will do some visualizations to become familiar with the technologies in use and then will pursue their own project to visualize some other data that they have or can find. Chapters 15 and 16 from the book “Python for Everybody” will serve as the backbone for the capstone. This course covers Python 3.
Introduction to Probability and Data with R
This course introduces you to sampling and exploring data, as well as basic probability theory and Bayes' rule. You will examine various types of sampling methods, and discuss how such methods can impact the scope of inference. A variety of exploratory data analysis techniques will be covered, including numeric summary statistics and basic data visualization. You will be guided through installing and using R and RStudio (free statistical software), and will use this software for lab exercises and a final project. The concepts and techniques in this course will serve as building blocks for the inference and modeling courses in the Specialization.
Running Distributed TensorFlow using Vertex AI
This is a self-paced lab that takes place in the Google Cloud console. In this lab, you will use TensorFlow's distribution strategies and the Vertex AI platform to train and deploy a custom TensorFlow image classification model to classify an image classification dataset.
ML Parameters Optimization: GridSearch, Bayesian, Random
Hello everyone and welcome to this new hands-on project on Machine Learning hyperparameters optimization. In this project, we will optimize machine learning regression models parameters using several techniques such as grid search, random search and Bayesian optimization. Hyperparameter optimization is a key step in developing machine learning models and it works by fine tuning ML models so they can optimally perform on a given dataset.
Create Experiments for Business or Research
In this project , you will learn how to set up an experiment for business or research question. You will create your own question and we will help you follow the steps to setting up an experiment.
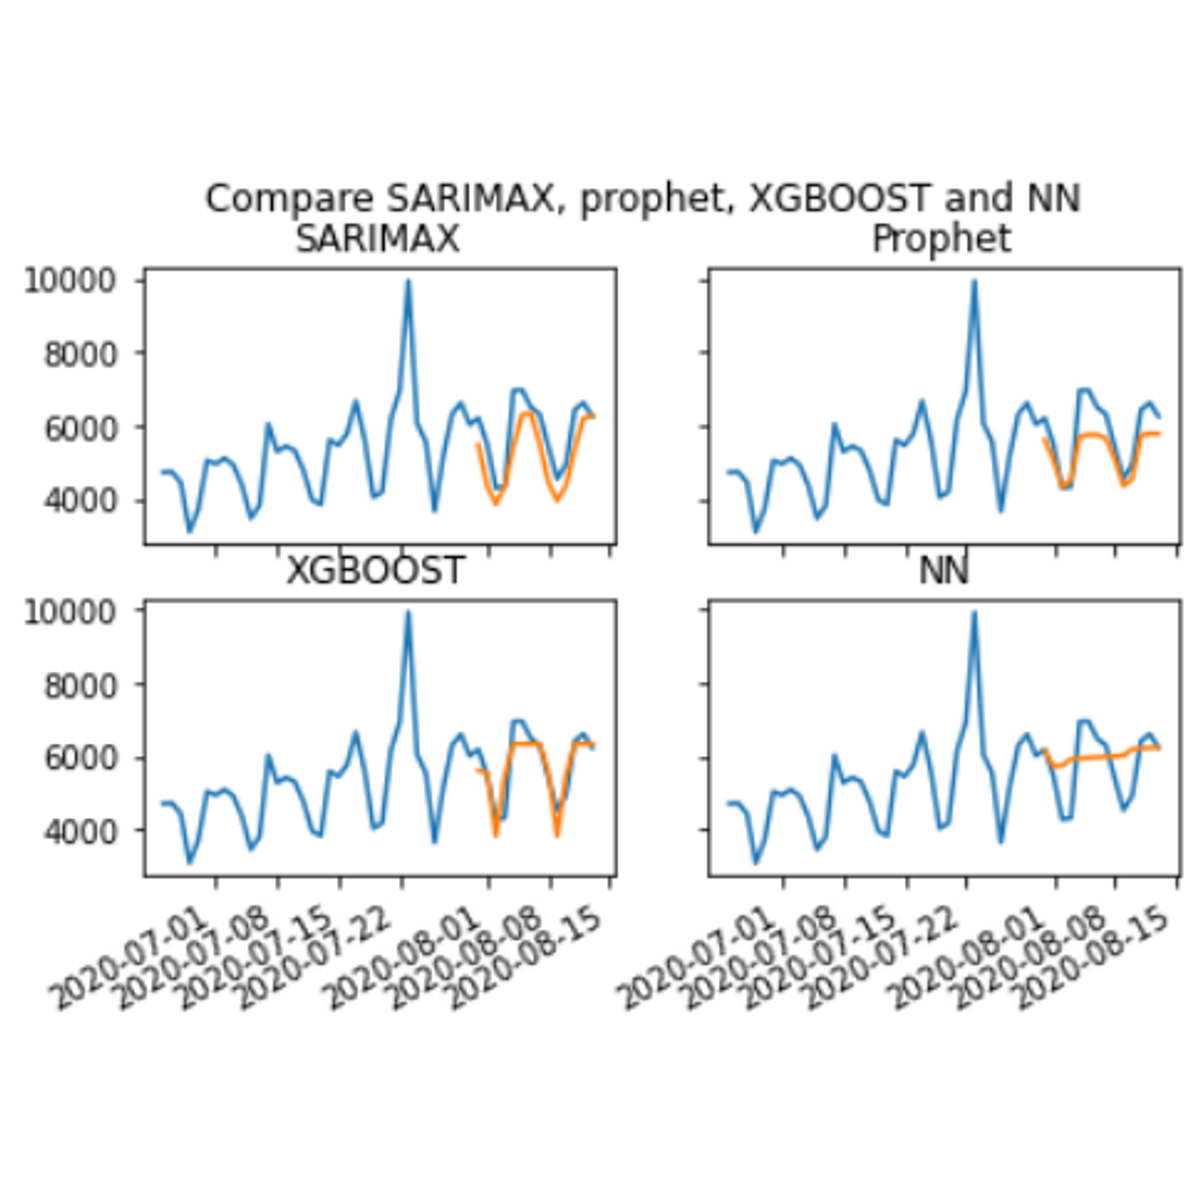
Compare time series predictions of COVID-19 deaths
By the end of this project, you will learn how to perform the entire time series analysis workflow for the daily COVID-19 deaths. This workflow includes the following steps: how to examine time series data, prepare the data for analysis, train different models and test their performance, and finally use the models to forecast into the future. You will learn how to visualize data using the matplotlib library, extract features from a time series data set, and perform data splitting and normalization. You will create time series analysis models using the python programming language. You will create and train four time series models: SARIMAX, Facebook prophet, neural networks and XGBOOST.
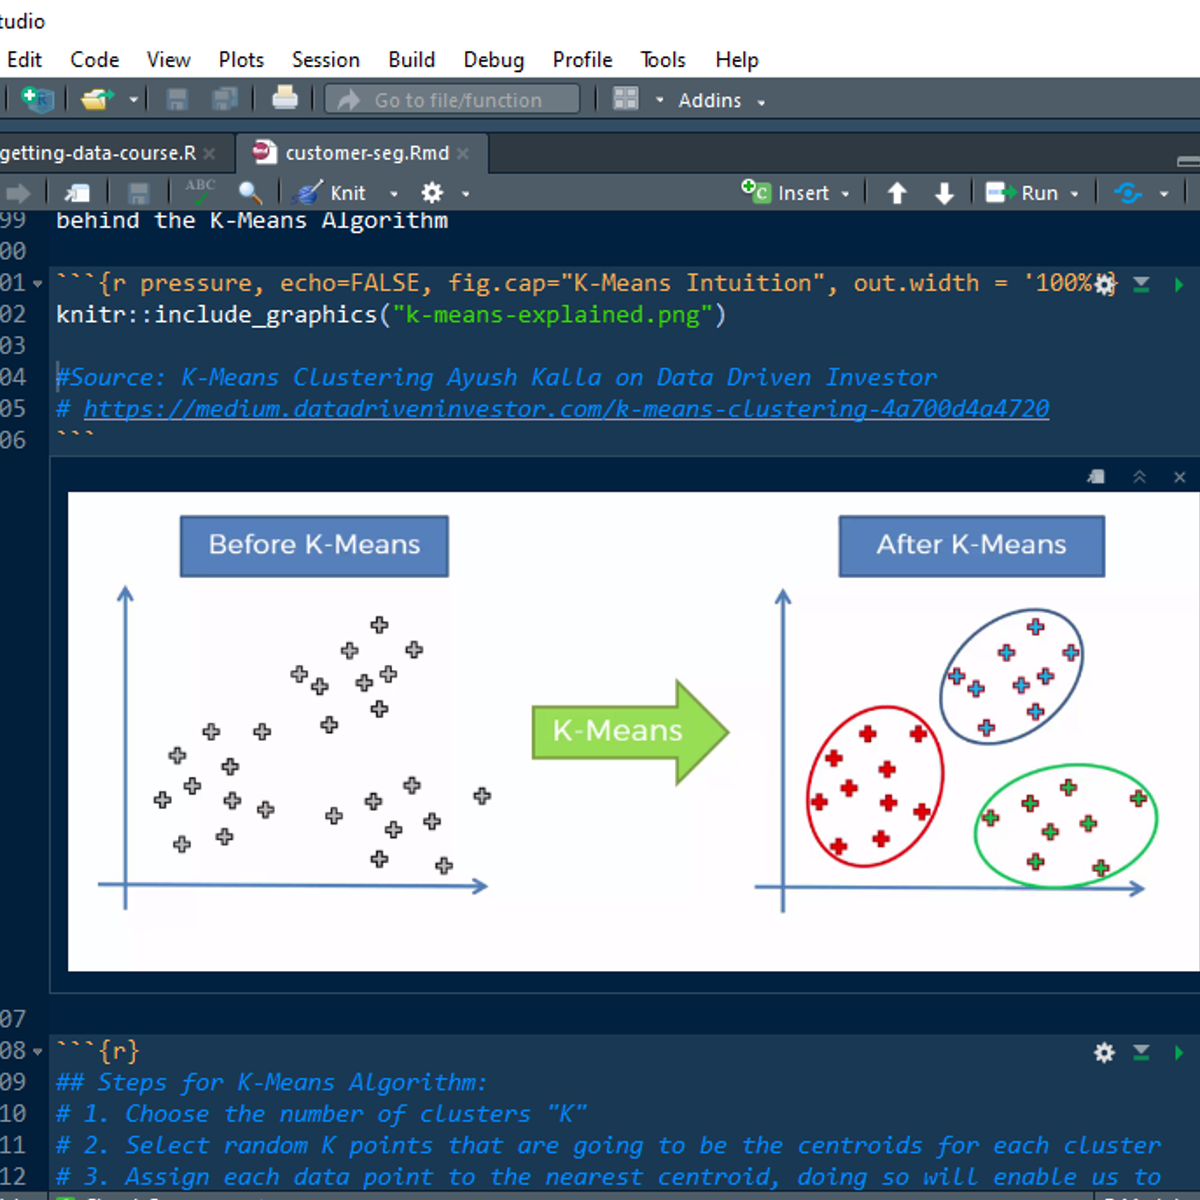
Customer Segmentation using K-Means Clustering in R
Welcome to this project-based course, Customer Segmentation using K-Means Clustering in R. In this project, you will learn how to perform customer market segmentation on mall customers data using different R packages.
By the end of this 2-and-a-half-hour long project, you will understand how to get the mall customers data into your RStudio workspace and explore the data. By extension, you will learn how to use the ggplot2 package to render beautiful plots of the data. Also, you will learn how to get the optimal number of clusters for the customers' segments and use K-Means to create distinct groups of customers based on their characteristics. Finally, you will learn how to use the R markdown file to organise your work and how to knit your code into an HTML document for publishing.
Although you do not need to be a data analyst expert or data scientist to succeed in this guided project, it requires a basic knowledge of using R, especially writing R syntaxes. Therefore, to complete this project, you must have prior experience with using R. If you are not familiar with working with using R, please go ahead to complete my previous project titled: “Getting Started with R”. It will hand you the needed knowledge to go ahead with this project on Customer Segmentation. However, if you are comfortable with working with R, please join me on this beautiful ride! Let’s get our hands dirty!
Data Science Capstone
The capstone project class will allow students to create a usable/public data product that can be used to show your skills to potential employers. Projects will be drawn from real-world problems and will be conducted with industry, government, and academic partners.
Popular Internships and Jobs by Categories
Browse
© 2024 BoostGrad | All rights reserved