
Back to Courses


Data Science Courses - Page 115
Showing results 1141-1150 of 1407
Analyze Data
This course is designed for business professionals that want to learn how to analyze data to gain insight, use statistical analysis methods to explore the underlying distribution of data, use visualizations such as histograms, scatter plots, and maps to analyze data and preprocess data to produce a dataset ready for training.
The typical student in this course will have several years of experience with computing technology, including some aptitude in computer programming.
Build, Train, and Deploy ML Pipelines using BERT
In the second course of the Practical Data Science Specialization, you will learn to automate a natural language processing task by building an end-to-end machine learning pipeline using Hugging Face’s highly-optimized implementation of the state-of-the-art BERT algorithm with Amazon SageMaker Pipelines. Your pipeline will first transform the dataset into BERT-readable features and store the features in the Amazon SageMaker Feature Store. It will then fine-tune a text classification model to the dataset using a Hugging Face pre-trained model, which has learned to understand the human language from millions of Wikipedia documents. Finally, your pipeline will evaluate the model’s accuracy and only deploy the model if the accuracy exceeds a given threshold.
Practical data science is geared towards handling massive datasets that do not fit in your local hardware and could originate from multiple sources. One of the biggest benefits of developing and running data science projects in the cloud is the agility and elasticity that the cloud offers to scale up and out at a minimum cost.
The Practical Data Science Specialization helps you develop the practical skills to effectively deploy your data science projects and overcome challenges at each step of the ML workflow using Amazon SageMaker. This Specialization is designed for data-focused developers, scientists, and analysts familiar with the Python and SQL programming languages and want to learn how to build, train, and deploy scalable, end-to-end ML pipelines - both automated and human-in-the-loop - in the AWS cloud.
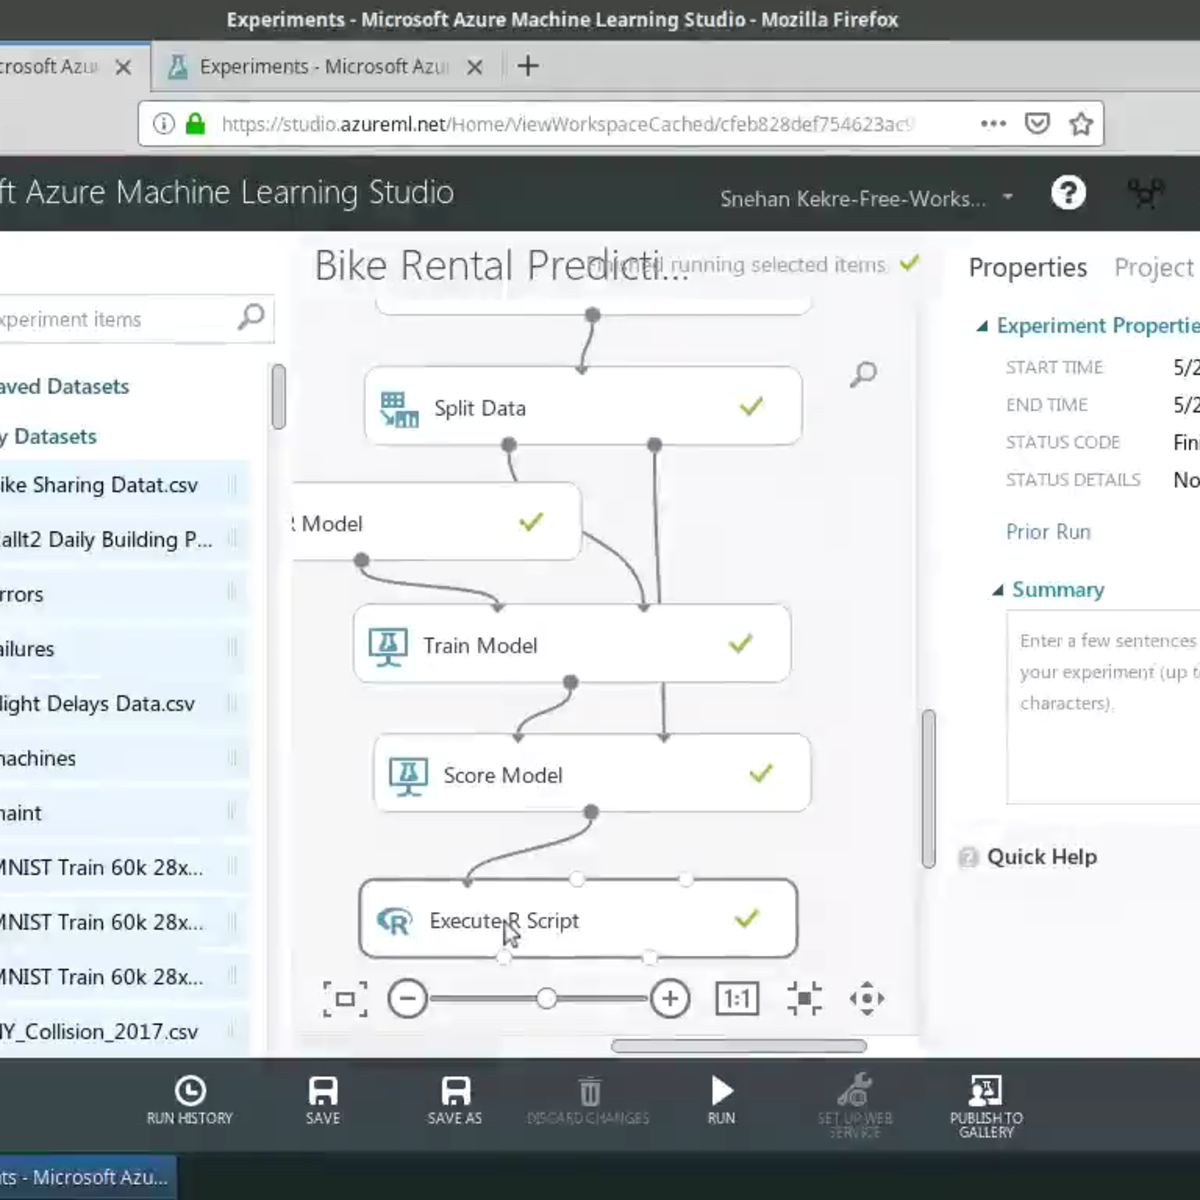
Build Random Forests in R with Azure ML Studio
In this project-based course you will learn to perform feature engineering and create custom R models on Azure ML Studio, all without writing a single line of code! You will build a Random Forests model in Azure ML Studio using the R programming language. The data to be used in this course is the Bike Sharing Dataset. The dataset contains the hourly and daily count of rental bikes between years 2011 and 2012 in Capital bikeshare system with the corresponding weather and seasonal information. Using the information from the dataset, you can build a model to predict the number of bikes rented during certain weather conditions. You will leverage the Execute R Script and Create R Model modules to run R scripts from the Azure ML Studio experiment perform feature engineering.
This is the fourth course in this series on building machine learning applications using Azure Machine Learning Studio. I highly encourage you to take the first course before proceeding. It has instructions on how to set up your Azure ML account with $200 worth of free credit to get started with running your experiments!
This course runs on Coursera's hands-on project platform called Rhyme. On Rhyme, you do projects in a hands-on manner in your browser. You will get instant access to pre-configured cloud desktops containing all of the software and data you need for the project. Everything is already set up directly in your internet browser so you can just focus on learning. For this project, you’ll get instant access to a cloud desktop with Python, Jupyter, and scikit-learn pre-installed.
Notes:
- You will be able to access the cloud desktop 5 times. However, you will be able to access instructions videos as many times as you want.
- This course works best for learners who are based in the North America region. We’re currently working on providing the same experience in other regions.
Data Science Project: MATLAB for the Real World
Like most subjects, practice makes perfect in Data Science. In the capstone project, you will apply the skills learned across courses in the Practical Data Science with MATLAB specialization to explore, process, analyze, and model data. You will choose your own pathway to answer key questions with the provided data.
To complete the project, you must have mastery of the skills covered in other courses in the specialization. The project will test your ability to import and explore your data, prepare the data for analysis, train a predictive model, evaluate and improve your model, and communicate your results.
Infonomics II: Business Information Management and Measurement
Even decades into the Information Age, accounting practices yet fail to recognize the financial value of information. Moreover, traditional asset management practices fail to recognize information as an asset to be managed with earnest discipline. This has led to a business culture of complacence, and the inability for most organizations to fully leverage available information assets.
This second course in the two-part Infonomics series explores how and why to adapt well-honed asset management principles and practices to information, and how to apply accepted and new valuation models to gauge information’s potential and realized economic benefits. In addition, the course will enlighten students on the critical but confounding issues of information ownership, property rights, and sovereignty. The course will wrap up with an overview of emergent roles for the information-savvy organization of the 21st century.
Explore stock prices with Spark SQL
In this 1-hour long project-based course, you will learn how to interact with a Spark cluster using Jupyter notebook and how to start a Spark application.
You will learn how to utilize Spark Resisilent Distributed Datasets and Spark Data Frames to explore a dataset. We will load a dataset into our Spark program, and perform analysis on it by using Actions, Transformations, Spark DataFrame API and Spark SQL.
You will learn how to choose the best tools to use for each scenario. Finally, you will learn to save your results in Parquet tables.
Information Theory
The lectures of this course are based on the first 11 chapters of Prof. Raymond Yeung’s textbook entitled Information Theory and Network Coding (Springer 2008). This book and its predecessor, A First Course in Information Theory (Kluwer 2002, essentially the first edition of the 2008 book), have been adopted by over 60 universities around the world as either a textbook or reference text.
At the completion of this course, the student should be able to:
1) Demonstrate knowledge and understanding of the fundamentals of information theory.
2) Appreciate the notion of fundamental limits in communication systems and more generally all systems.
3) Develop deeper understanding of communication systems.
4) Apply the concepts of information theory to various disciplines in information science.
Foundations of Sports Analytics: Data, Representation, and Models in Sports
This course provides an introduction to using Python to analyze team performance in sports. Learners will discover a variety of techniques that can be used to represent sports data and how to extract narratives based on these analytical techniques. The main focus of the introduction will be on the use of regression analysis to analyze team and player performance data, using examples drawn from the National Football League (NFL), the National Basketball Association (NBA), the National Hockey League (NHL), the English Premier LEague (EPL, soccer) and the Indian Premier League (IPL, cricket).
This course does not simply explain methods and techniques, it enables the learner to apply them to sports datasets of interest so that they can generate their own results, rather than relying on the data processing performed by others. As a consequence the learning will be empowered to explore their own ideas about sports team performance, test them out using the data, and so become a producer of sports analytics rather than a consumer.
While the course materials have been developed using Python, code has also been produced to derive all of the results in R, for those who prefer that environment.
Creating a Looker Modeled Query and Working with Quick Start
This is a self-paced lab that takes place in the Google Cloud console.
Looker provides the ability for LookML developers to build modeled queries that help all Looker business users quickly get started and easily explore data in the platform.
This three-task lab will provide you with practical, hands-on experience using the query parameter to create a modeled query for an Explore. The modeled query is listed in the Quick Start section of a blank Explore. Modeled queries are extremely helpful to Looker business users, since you can specify elements like the dimensions, measures, filters, and pivots that may be the most relevant and insightful. In this lab you will learn how to create a modeled query, which can be a helpful starting point for users who are new to Looker and learning how to query data.
Functional Programming in Scala Capstone
In the final capstone project you will apply the skills you learned by building a large data-intensive application using real-world data.
You will implement a complete application processing several gigabytes of data. This application will show interactive visualizations of the evolution of temperatures over time all over the world.
The development of such an application will involve:
— transforming data provided by weather stations into meaningful information like, for instance, the average temperature of each point of the globe over the last ten years ;
— then, making images from this information by using spatial and linear interpolation techniques ;
— finally, implementing how the user interface will react to users’ actions.
Popular Internships and Jobs by Categories
Browse
© 2024 BoostGrad | All rights reserved