
Back to Courses


Data Science Courses - Page 114
Showing results 1131-1140 of 1407
Basic Image Classification with TensorFlow
In this 2-hour long project-based course, you will learn the basics of using Keras with TensorFlow as its backend and use it to solve a basic image classification problem. By the end of this project, you will have created, trained, and evaluated a Neural Network model that will be able to predict digits from hand-written images with a high degree of accuracy. You also will have learned the fundamentals of neural networks, TensorFlow, and Keras.
Note: This course works best for learners who are based in the North America region. We’re currently working on providing the same experience in other regions.
Reinforcement Learning for Trading Strategies
In the final course from the Machine Learning for Trading specialization, you will be introduced to reinforcement learning (RL) and the benefits of using reinforcement learning in trading strategies. You will learn how RL has been integrated with neural networks and review LSTMs and how they can be applied to time series data. By the end of the course, you will be able to build trading strategies using reinforcement learning, differentiate between actor-based policies and value-based policies, and incorporate RL into a momentum trading strategy.
To be successful in this course, you should have advanced competency in Python programming and familiarity with pertinent libraries for machine learning, such as Scikit-Learn, StatsModels, and Pandas. Experience with SQL is recommended. You should have a background in statistics (expected values and standard deviation, Gaussian distributions, higher moments, probability, linear regressions) and foundational knowledge of financial markets (equities, bonds, derivatives, market structure, hedging).
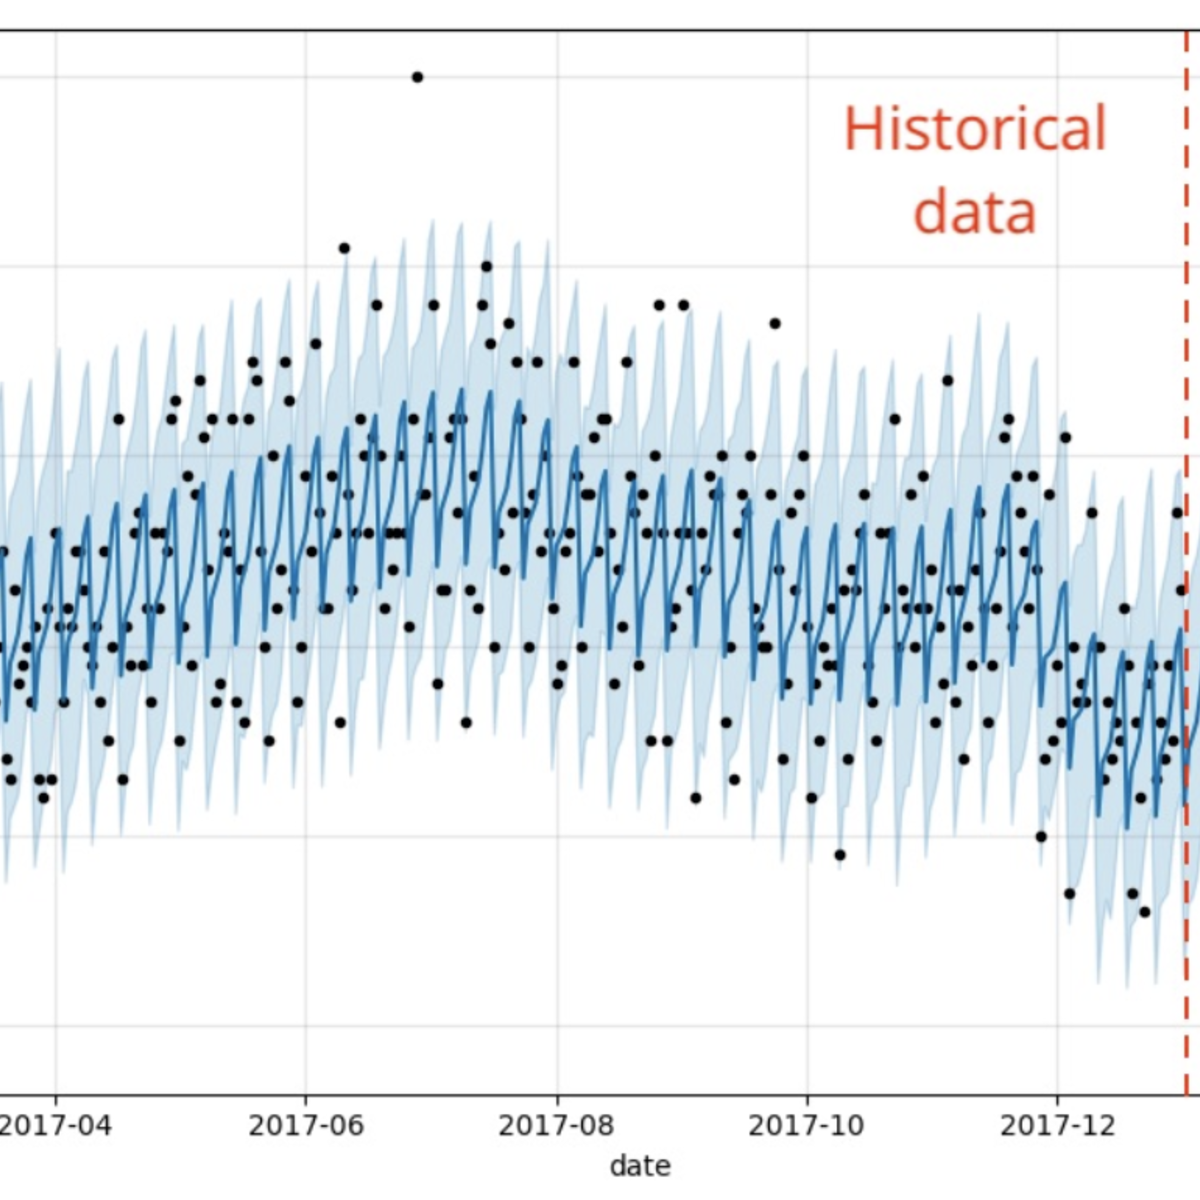
Intro to Time Series Analysis in R
In this 2 hour long project-based course, you will learn the basics of time series analysis in R. By the end of this project, you will understand the essential theory for time series analysis and have built each of the major model types (Autoregressive, Moving Average, ARMA, ARIMA, and decomposition) on a real world data set to forecast the future. We will go over the essential packages and functions in R as well to make time series analysis easy.
Basic Data Descriptors, Statistical Distributions, and Application to Business Decisions
The ability to understand and apply Business Statistics is becoming increasingly important in the industry. A good understanding of Business Statistics is a requirement to make correct and relevant interpretations of data. Lack of knowledge could lead to erroneous decisions which could potentially have negative consequences for a firm. This course is designed to introduce you to Business Statistics. We begin with the notion of descriptive statistics, which is summarizing data using a few numbers. Different categories of descriptive measures are introduced and discussed along with the Excel functions to calculate them. The notion of probability or uncertainty is introduced along with the concept of a sample and population data using relevant business examples. This leads us to various statistical distributions along with their Excel functions which are then used to model or approximate business processes. You get to apply these descriptive measures of data and various statistical distributions using easy-to-follow Excel based examples which are demonstrated throughout the course.
To successfully complete course assignments, students must have access to Microsoft Excel.
________________________________________
WEEK 1
Module 1: Basic Data Descriptors
In this module you will get to understand, calculate and interpret various descriptive or summary measures of data. These descriptive measures summarize and present data using a few numbers. Appropriate Excel functions to do these calculations are introduced and demonstrated.
Topics covered include:
• Categories of descriptive data
• Measures of central tendency, the mean, median, mode, and their interpretations and calculations
• Measures of spread-in-data, the range, interquartile-range, standard deviation and variance
• Box plots
• Interpreting the standard deviation measure using the rule-of-thumb and Chebyshev’s theorem
________________________________________
WEEK 2
Module 2: Descriptive Measures of Association, Probability, and Statistical Distributions
This module presents the covariance and correlation measures and their respective Excel functions. You get to understand the notion of causation versus correlation. The module then introduces the notion of probability and random variables and starts introducing statistical distributions.
Topics covered include:
• Measures of association, the covariance and correlation measures; causation versus correlation
• Probability and random variables; discrete versus continuous data
• Introduction to statistical distributions
________________________________________
WEEK 3
Module 3: The Normal Distribution
This module introduces the Normal distribution and the Excel function to calculate probabilities and various outcomes from the distribution.
Topics covered include:
• Probability density function and area under the curve as a measure of probability
• The Normal distribution (bell curve), NORM.DIST, NORM.INV functions in Excel
________________________________________
WEEK 4
Module 4: Working with Distributions, Normal, Binomial, Poisson
In this module, you'll see various applications of the Normal distribution. You will also get introduced to the Binomial and Poisson distributions. The Central Limit Theorem is introduced and explained in the context of understanding sample data versus population data and the link between the two.
Topics covered include:
• Various applications of the Normal distribution
• The Binomial and Poisson distributions
• Sample versus population data; the Central Limit Theorem
Ingesting FHIR Data with the Healthcare API
This is a self-paced lab that takes place in the Google Cloud console. In this lab you will learn the basic functionalities of Cloud Healthcare API using the Fast Healthcare Interoperability (FHIR) data model.
Data Visualization in Microsoft PowerPoint
By the end of this project, you will create a free account on Microsoft 365, you will get access to Microsoft PowerPoint, and you will create a presentation with data that will be efficiently visualized. Your new skills will help you create a presentation that demonstrates data in the most efficient way.
Applying Data Analytics in Marketing
This course introduces students to marketing analytics through a wide range of analytical tools and approaches. We will discuss causal analysis, survey analysis using regression, textual analysis (sentiment analysis), and network analysis. This course aims to provide the foundation required to make better marketing decisions by analyzing multiple types of data related to customer satisfaction.
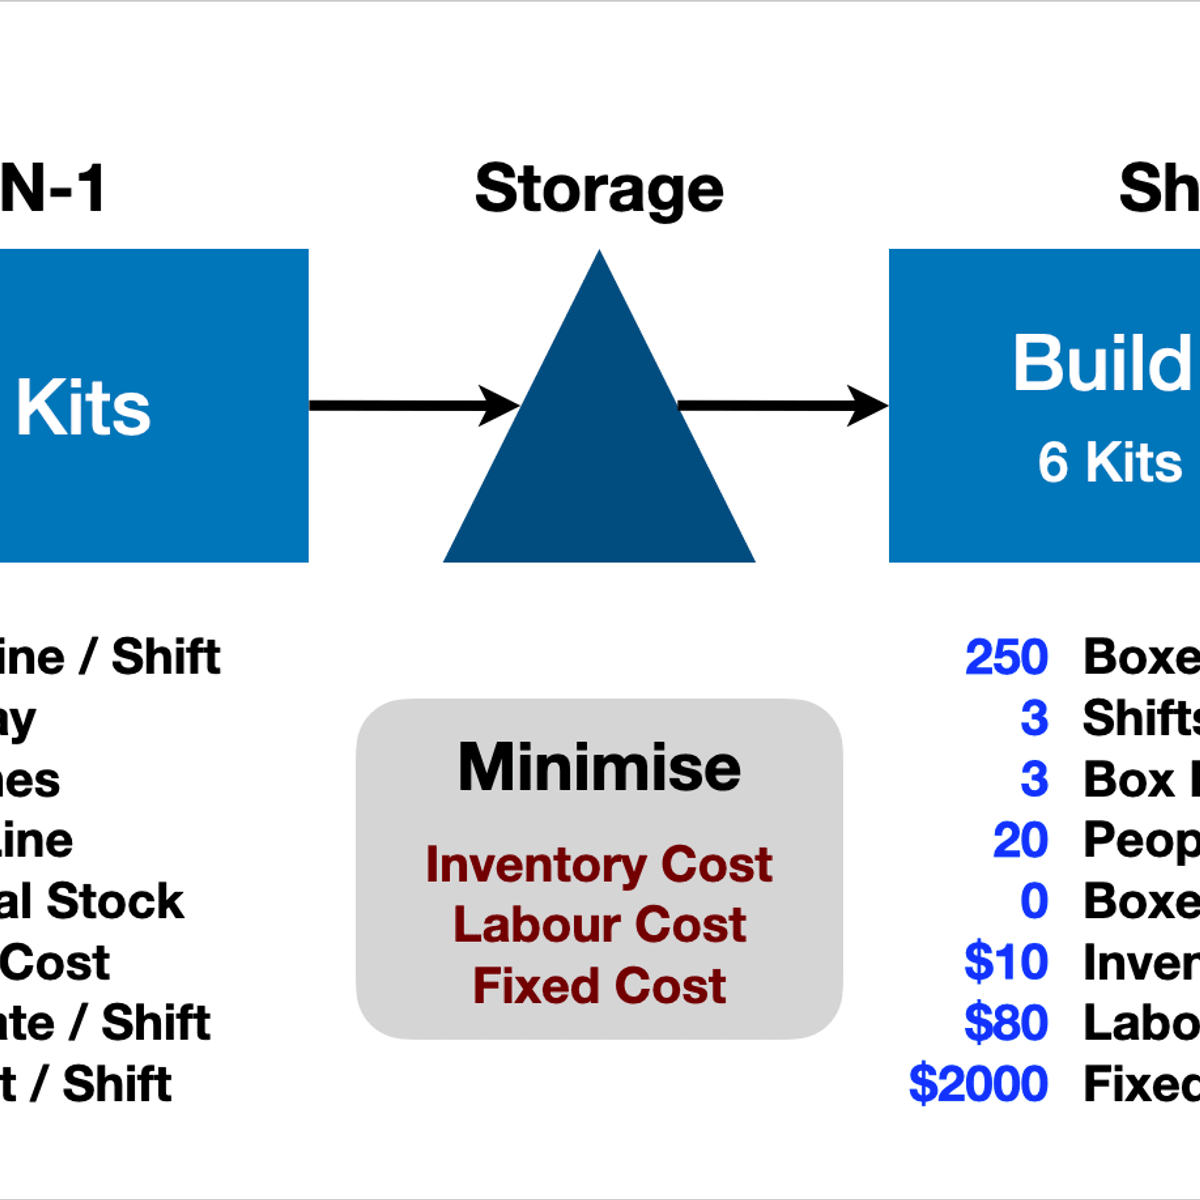
Two Stage Production System Optimization With R lpSolveAPI
Two Stage Production System Optimization With R lpSolveAPI
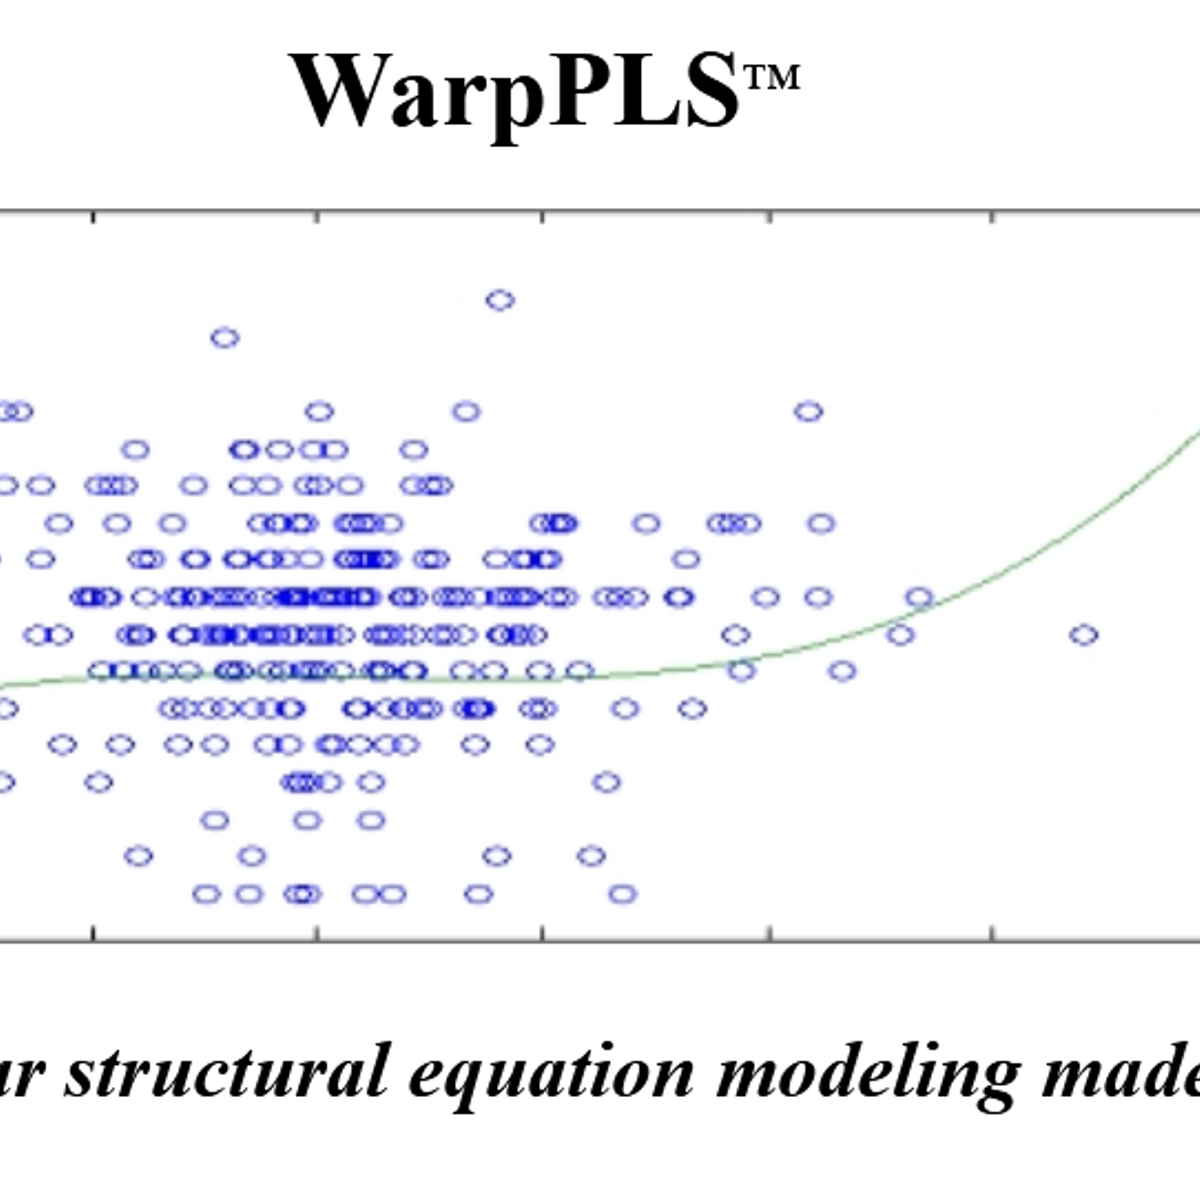
Modelling with WARP PLS
In this 1-hour long project-based course, you will learn how to create path models using Smartpls. We will take a project on changing behavior and check if attitudes or subjective norms impact behavior the most.
We will learn how to launch this new software, create the model and run it. We will then show you how to interpret the same. We will also learn how to create models for different groups such as males and females and if there is a difference between them.
Note: This course works best for learners who are based in the North America region. We’re currently working on providing the same experience in other regions.
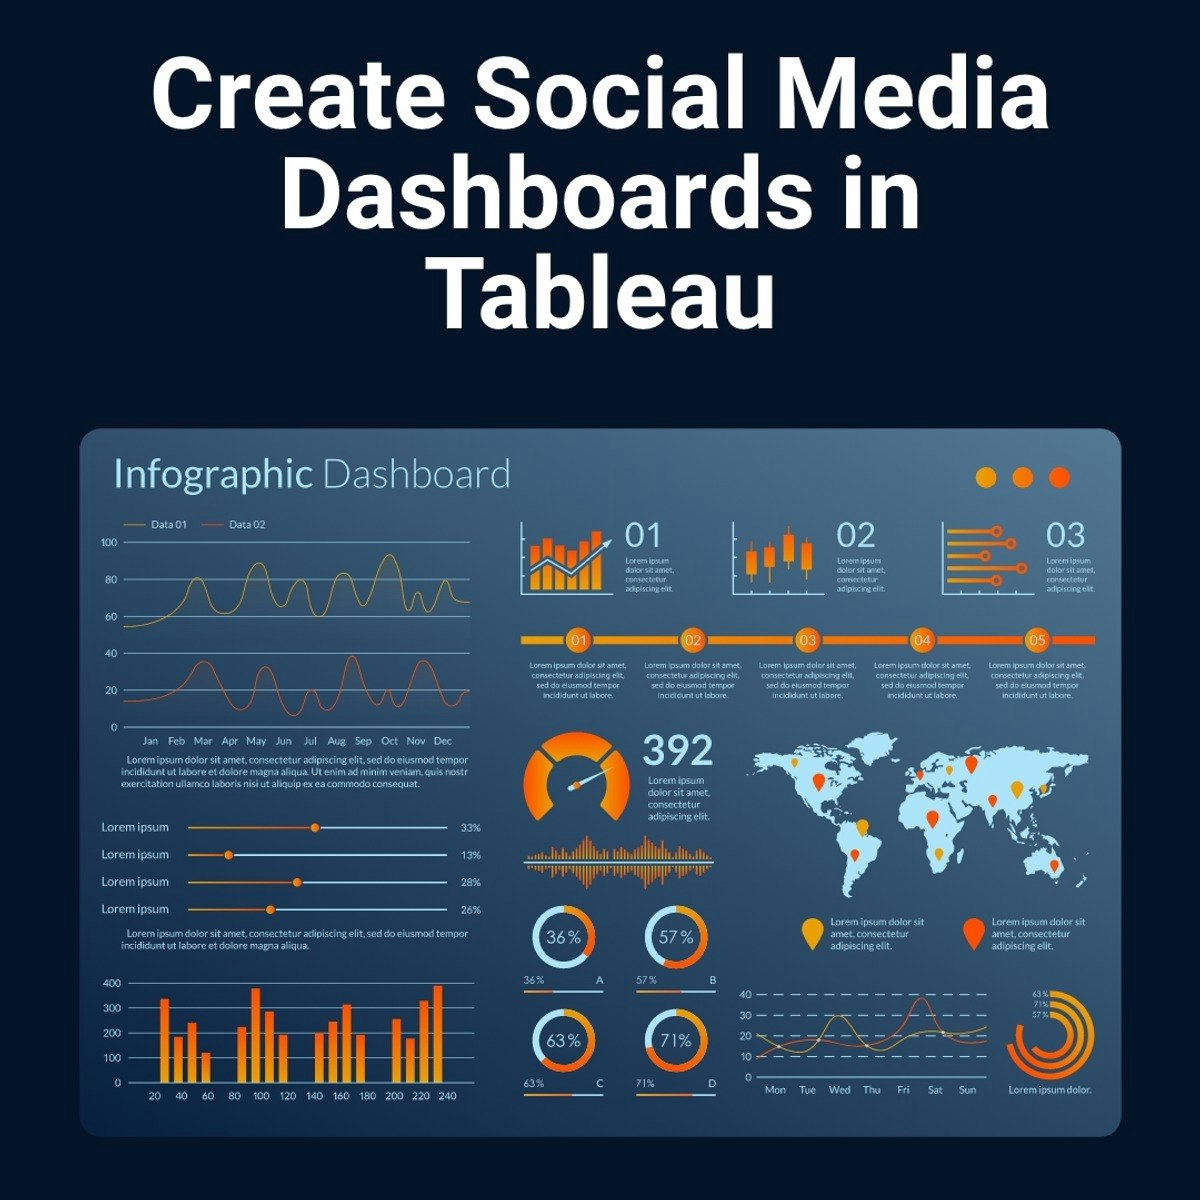
Create Social Media Dashboards in Tableau
Social Media has fundamentally changed how we think about marketing. Brands of all sizes are using social media to not only grow a following but to learn more about what our target audience(s) are interested in. As social media advertising is growing by leaps and bounds, it’s important to understand which ads are working and which ones need some more attention. Learning how to visualize this data can make it easier to make decisions about what to do next.
In this course, learners will learn how to create an account, how to do some basic data cleaning, and how to upload data to Tableau. Learners will also learn how to create big number visualizations, tables, word charts, and bubble charts. Finally, learners will combine these visualizations into dashboards.
The ideal learner for this project will be someone who is making decisions about social media. They should be somewhat familiar with social media terms and general practices.
Popular Internships and Jobs by Categories
Browse
© 2024 BoostGrad | All rights reserved