
Back to Courses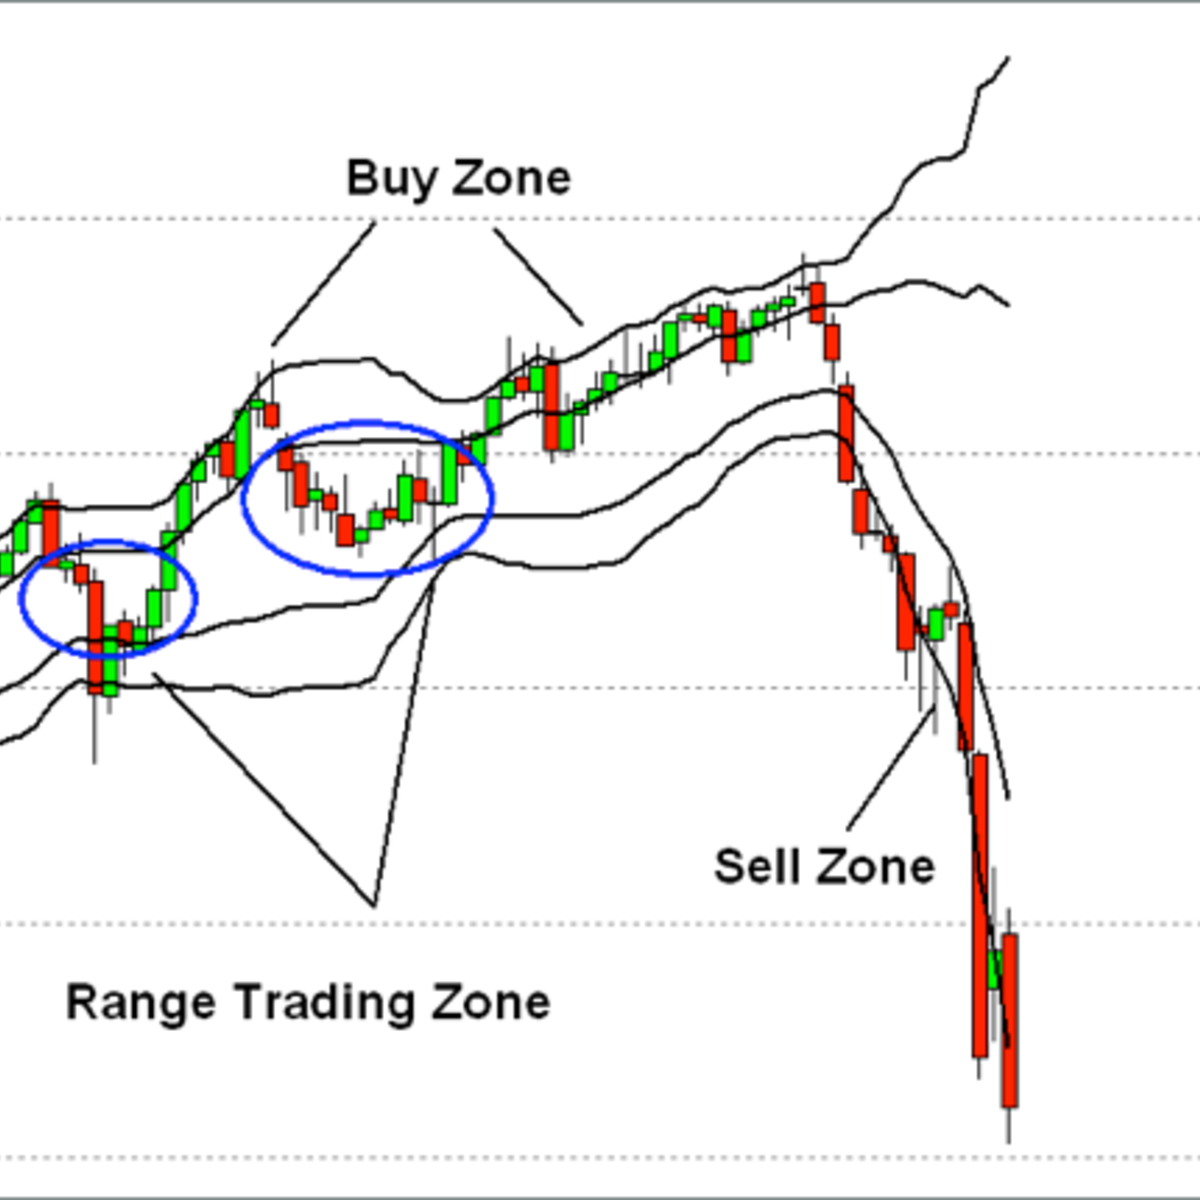


Data Science Courses - Page 113
Showing results 1121-1130 of 1407
Create Technical Stock Charts Using R and Quantmod
In this 1-hour long project-based course, you will learn how to pull down Stock Data using the R quantmod Package and Yahoo Finance API. You will also learn how to apply Technical Indicators to the data and draw graphs based on those Indicators.
Note: This course works best for learners who are based in the North America region. We’re currently working on providing the same experience in other regions.
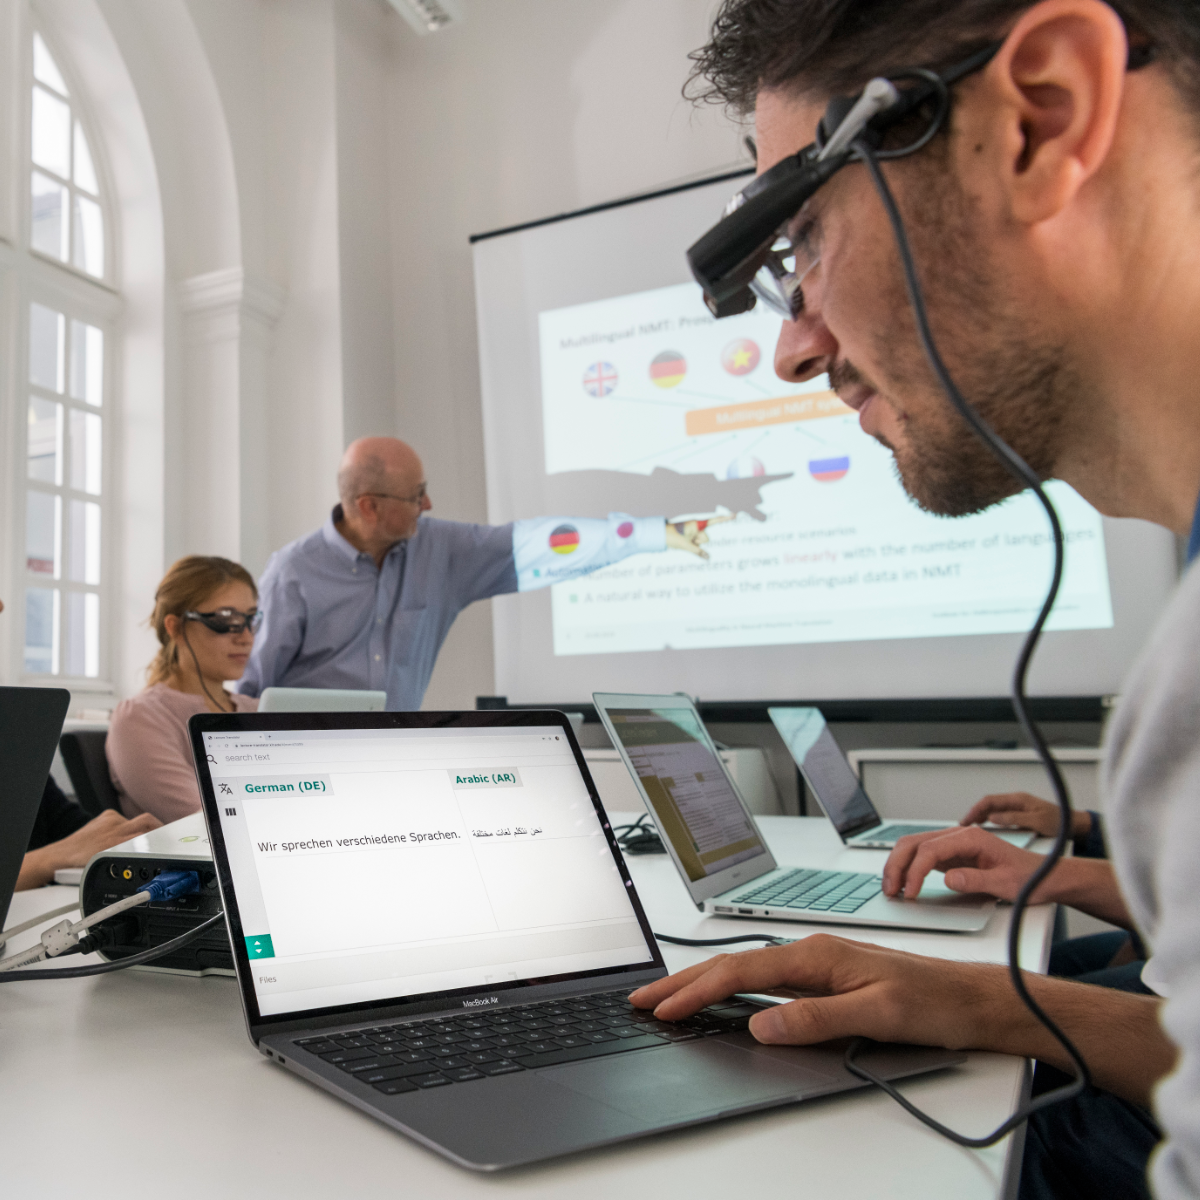
Machine Translation
Welcome to the CLICS-Machine Translation MOOC
This MOOC explains the basic principles of machine translation. Machine translation is the task of translating from one natural language to another natural language. Therefore, these algorithms can help people communicate in different languages. Such algorithms are used in common applications, from Google Translate to apps on your mobile device.
After taking this course you will be able to understand the main difficulties of translating natural languages and the principles of different machine translation approaches. A main focus of the course will be the current state-of-the-art neural machine translation technology which uses deep learning methods to model the translation process. You will be able to decide which concepts fit your machine translation application best.
This course is taught by Prof. Dr. Alexander Waibel (http://isl.anthropomatik.kit.edu/english/21_74.php) and Assistant Professor Dr. Jan Niehus (https://www.maastrichtuniversity.nl/jan.niehues).
Random Models, Nested and Split-plot Designs
Many experiments involve factors whose levels are chosen at random. A well-know situation is the study of measurement systems to determine their capability. This course presents the design and analysis of these types of experiments, including modern methods for estimating the components of variability in these systems. The course also covers experiments with nested factors, and experiments with hard-to-change factors that require split-plot designs. We also provide an overview of designs for experiments with response distributions from nonnormal response distributions and experiments with covariates.
Study Designs in Epidemiology
Choosing an appropriate study design is a critical decision that can largely determine whether your study will successfully answer your research question. A quick look at the contents page of a biomedical journal or even at the health news section of a news website is enough to tell you that there are many different ways to conduct epidemiological research.
In this course, you will learn about the main epidemiological study designs, including cross-sectional and ecological studies, case-control and cohort studies, as well as the more complex nested case-control and case-cohort designs. The final module is dedicated to randomised controlled trials, which is often considered the optimal study design, especially in clinical research. You will also develop the skills to identify strengths and limitations of the various study designs. By the end of this course, you will be able to choose the most suitable study design considering the research question, the available time, and resources.
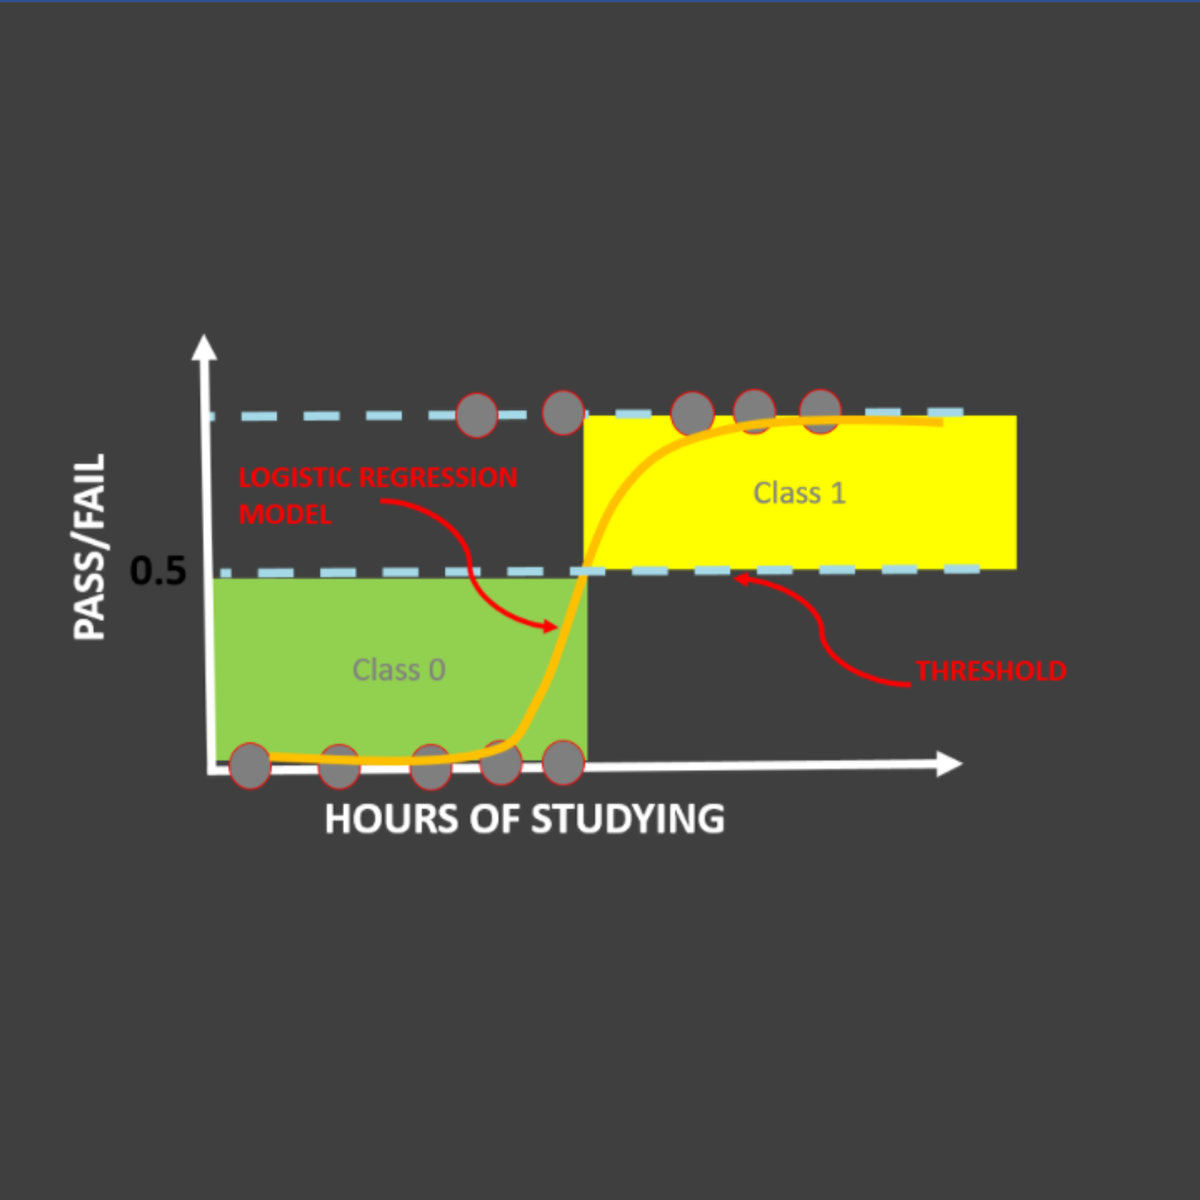
Logistic Regression 101: US Household Income Classification
In this hands-on project, we will train Logistic Regression and XG-Boost models to predict whether a particular person earns less than 50,000 US Dollars or more than 50,000 US Dollars annually. This data was obtained from U.S. Census database and consists of features like occupation, age, native country, capital gain, education, and work class.
By the end of this project, you will be able to:
- Understand the theory and intuition behind Logistic Regression and XG-Boost models
- Import key Python libraries, dataset, and perform Exploratory Data Analysis like removing missing values, replacing characters, etc.
- Perform data visualization using Seaborn.
- Prepare the data to increase the predictive power of Machine Learning models by One-Hot Encoding, Label Encoding, and Train/Test Split
- Build and train Logistic Regression and XG-Boost models to classify the Income Bracket of U.S. Household.
- Assess the performance of trained model and ensure its generalization using various KPIs such as accuracy, precision and recall.
Note: This course works best for learners who are based in the North America region. We’re currently working on providing the same experience in other regions.
Data Visualization with Python
One of the most important skills of successful data scientists and data analysts is the ability to tell a compelling story by visualizing data and findings in an approachable and stimulating way. In this course you will learn many ways to effectively visualize both small and large-scale data. You will be able to take data that at first glance has little meaning and present that data in a form that conveys insights.
This course will teach you to work with many Data Visualization tools and techniques. You will learn to create various types of basic and advanced graphs and charts like: Waffle Charts, Area Plots, Histograms, Bar Charts, Pie Charts, Scatter Plots, Word Clouds, Choropleth Maps, and many more! You will also create interactive dashboards that allow even those without any Data Science experience to better understand data, and make more effective and informed decisions.
You will learn hands-on by completing numerous labs and a final project to practice and apply the many aspects and techniques of Data Visualization using Jupyter Notebooks and a Cloud-based IDE. You will use several data visualization libraries in Python, including Matplotlib, Seaborn, Folium, Plotly & Dash.
Getting Started with Kaggle
In this guided project, you will explore Kaggle Competitions, Kaggle Datasets, Kaggle Notebooks which is a cloud-based coding environment, Kaggle Discussion forum and Kaggle Courses.
We will begin this course by creating a Kaggle account. We will then explore Kaggle competitions, the prize money and how to participate in them. We will focus primarily on the legendary Titanic Machine learning competition. We will explore Kaggle datasets. We will also explore Kaggle Notebooks which is a cloud-based coding environment. We will also explore the awesome “Copy and Edit” feature from Kaggle notebooks that enables us to work on and improvise on the work of others. In the final tasks, we will explore the Kaggle community discussion forum and explore the theoretical and practical sections of Kaggle courses.
By the end of this project, you will be confident in using Kaggle for your data science and machine learning needs.
Introduction to Line Balancing Using Precedence Diagram
In this 1-hour 30-minutes long project-based course, you will learn how to o define what is meant by cycle time and how to calculate it, draw a precedence diagram for your given process and calculate the idle time for this process, you will be able to calculate the efficiency of the system and the minimum number of workstations and how to assign tasks to these workstations, by applying all of these you will create a complete line balancing system.
Note: This course works best for learners who are based in the North America region. We’re currently working on providing the same experience in other regions.
Inferential Statistics
This course covers commonly used statistical inference methods for numerical and categorical data. You will learn how to set up and perform hypothesis tests, interpret p-values, and report the results of your analysis in a way that is interpretable for clients or the public. Using numerous data examples, you will learn to report estimates of quantities in a way that expresses the uncertainty of the quantity of interest. You will be guided through installing and using R and RStudio (free statistical software), and will use this software for lab exercises and a final project. The course introduces practical tools for performing data analysis and explores the fundamental concepts necessary to interpret and report results for both categorical and numerical data
Classify Images of Clouds in the Cloud with AutoML Vision
This is a self-paced lab that takes place in the Google Cloud console. AutoML Vision helps developers with limited ML expertise train high-quality image recognition models. In this hands-on lab, you will learn how to train a custom model to recognize different types of clouds (cumulus, cumulonimbus, etc.).
Popular Internships and Jobs by Categories
Browse
© 2024 BoostGrad | All rights reserved