Back to Courses
A Simple Scatter Plot using D3 js
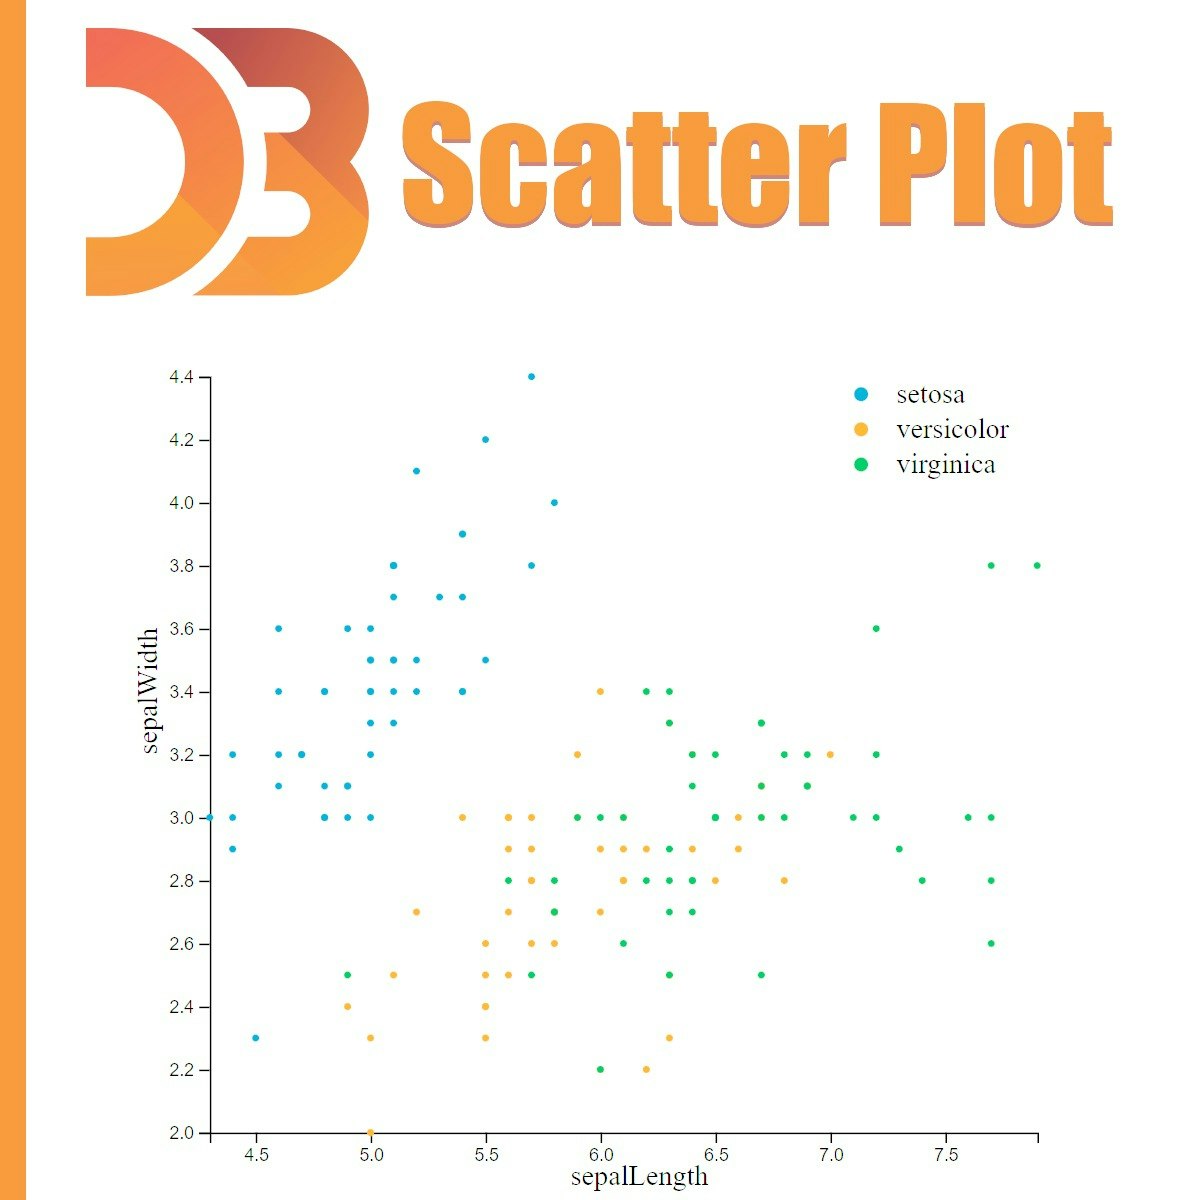
Overview
During this guided project, you will create a simple scatter plot using D3 js. Starting from loading our dataset we are going to cover some steps in order to create a fully functional scatter plot. We will also cover some important topics in data visualization such as Linear and Ordinal scaling to best visualize our data. Having the knowledge of javascript programming language and the basics of d3 js are the two most important prerequisites to get the most out of this guided project.
Your dream job is just a tap away — only on the BoostGrad app.

View on Boostgrad App
View on Browser
Continue
Download the app