Back to Courses





Probability And Statistics Courses - Page 9
Showing results 81-90 of 133

Bayesian Statistics: From Concept to Data Analysis
This course introduces the Bayesian approach to statistics, starting with the concept of probability and moving to the analysis of data. We will learn about the philosophy of the Bayesian approach as well as how to implement it for common types of data. We will compare the Bayesian approach to the more commonly-taught Frequentist approach, and see some of the benefits of the Bayesian approach. In particular, the Bayesian approach allows for better accounting of uncertainty, results that have more intuitive and interpretable meaning, and more explicit statements of assumptions. This course combines lecture videos, computer demonstrations, readings, exercises, and discussion boards to create an active learning experience. For computing, you have the choice of using Microsoft Excel or the open-source, freely available statistical package R, with equivalent content for both options. The lectures provide some of the basic mathematical development as well as explanations of philosophy and interpretation. Completion of this course will give you an understanding of the concepts of the Bayesian approach, understanding the key differences between Bayesian and Frequentist approaches, and the ability to do basic data analyses.

Understanding and Visualizing Data with Python
In this course, learners will be introduced to the field of statistics, including where data come from, study design, data management, and exploring and visualizing data. Learners will identify different types of data, and learn how to visualize, analyze, and interpret summaries for both univariate and multivariate data. Learners will also be introduced to the differences between probability and non-probability sampling from larger populations, the idea of how sample estimates vary, and how inferences can be made about larger populations based on probability sampling.
At the end of each week, learners will apply the statistical concepts they’ve learned using Python within the course environment. During these lab-based sessions, learners will discover the different uses of Python as a tool, including the Numpy, Pandas, Statsmodels, Matplotlib, and Seaborn libraries. Tutorial videos are provided to walk learners through the creation of visualizations and data management, all within Python. This course utilizes the Jupyter Notebook environment within Coursera.

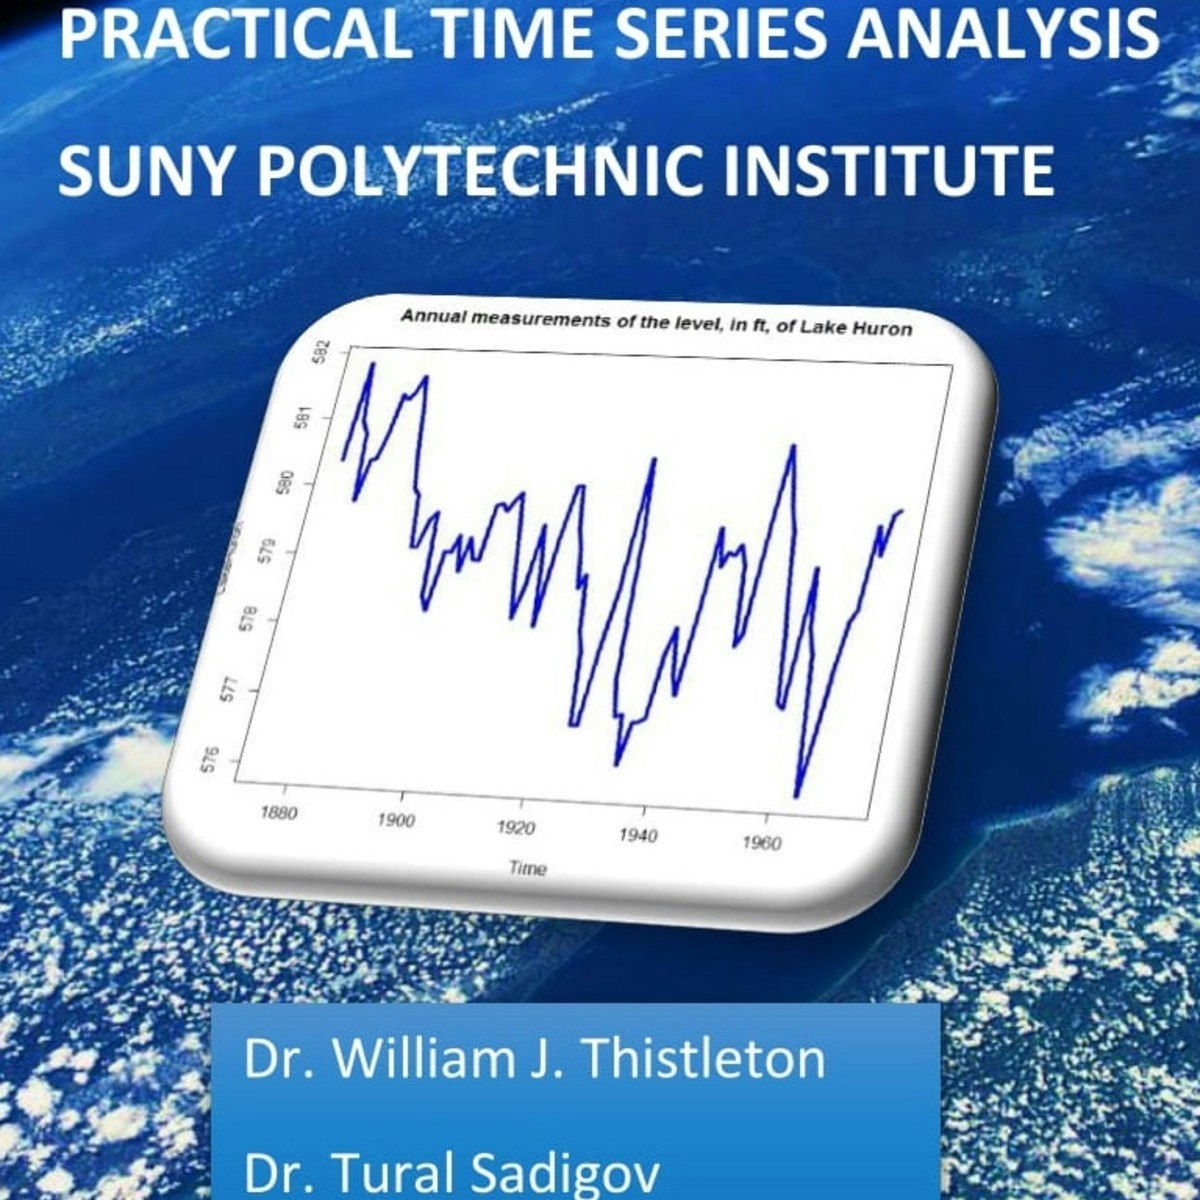
Practical Time Series Analysis
Welcome to Practical Time Series Analysis!
Many of us are "accidental" data analysts. We trained in the sciences, business, or engineering and then found ourselves confronted with data for which we have no formal analytic training. This course is designed for people with some technical competencies who would like more than a "cookbook" approach, but who still need to concentrate on the routine sorts of presentation and analysis that deepen the understanding of our professional topics.
In practical Time Series Analysis we look at data sets that represent sequential information, such as stock prices, annual rainfall, sunspot activity, the price of agricultural products, and more. We look at several mathematical models that might be used to describe the processes which generate these types of data. We also look at graphical representations that provide insights into our data. Finally, we also learn how to make forecasts that say intelligent things about what we might expect in the future.
Please take a few minutes to explore the course site. You will find video lectures with supporting written materials as well as quizzes to help emphasize important points. The language for the course is R, a free implementation of the S language. It is a professional environment and fairly easy to learn.
You can discuss material from the course with your fellow learners. Please take a moment to introduce yourself!
Time Series Analysis can take effort to learn- we have tried to present those ideas that are "mission critical" in a way where you understand enough of the math to fell satisfied while also being immediately productive. We hope you enjoy the class!

Performing Confirmatory Data Analysis in R
Welcome to this project-based course Performing Confirmatory Data Analysis in R. In this project, you will learn how to perform extensive confirmatory data analysis, which is similar to performing inferential statistics in R.
By the end of this 2-hour long project, you will understand how to perform chi-square tests, which includes, the goodness of fit test, test for independence, and test for homogeneity. Also, you will learn how to calculate correlation for numeric variables and perform regression analysis. Also, you will learn how to interpret the results of a test and make viable decisions. By extension, you will learn how to explore some built-in R datasets to perform the different tests.
Note, you do not need to be a data scientist or statistical analyst to be successful in this guided project, just a familiarity with basic statistics and performing hypothesis test in R suffice for this project. A fundamental prerequisite is having a good understanding of the theory of hypothesis test. So, I recommend that you should take the Hypothesis Testing in R project before taking this project.

TFX on Google Cloud Vertex Pipelines
This is a self-paced lab that takes place in the Google Cloud console. In this lab you will develop, deploy, and run a TFX pipeline on Google Cloud Vertex Pipelines.

Explaining machine learning models
In this 2-hour long project-based course, you will learn how to understand the predictions of your model, feature relations, visualize and interpret feature & model relation with statistics and much more.

Econometrics: Methods and Applications
Welcome!
Do you wish to know how to analyze and solve business and economic questions with data analysis tools? Then Econometrics by Erasmus University Rotterdam is the right course for you, as you learn how to translate data into models to make forecasts and to support decision making.
* What do I learn?
When you know econometrics, you are able to translate data into models to make forecasts and to support decision making in a wide variety of fields, ranging from macroeconomics to finance and marketing. Our course starts with introductory lectures on simple and multiple regression, followed by topics of special interest to deal with model specification, endogenous variables, binary choice data, and time series data. You learn these key topics in econometrics by watching the videos with in-video quizzes and by making post-video training exercises.
* Do I need prior knowledge?
The course is suitable for (advanced undergraduate) students in economics, finance, business, engineering, and data analysis, as well as for those who work in these fields. The course requires some basics of matrices, probability, and statistics, which are reviewed in the Building Blocks module. If you are searching for a MOOC on econometrics of a more introductory nature that needs less background in mathematics, you may be interested in the Coursera course “Enjoyable Econometrics” that is also from Erasmus University Rotterdam.
* What literature can I consult to support my studies?
You can follow the MOOC without studying additional sources. Further reading of the discussed topics (including the Building Blocks) is provided in the textbook that we wrote and on which the MOOC is based: Econometric Methods with Applications in Business and Economics, Oxford University Press. The connection between the MOOC modules and the book chapters is shown in the Course Guide – Further Information – How can I continue my studies.
* Will there be teaching assistants active to guide me through the course?
Staff and PhD students of our Econometric Institute will provide guidance in January and February of each year. In other periods, we provide only elementary guidance. We always advise you to connect with fellow learners of this course to discuss topics and exercises.
* How will I get a certificate?
To gain the certificate of this course, you are asked to make six Test Exercises (one per module) and a Case Project. Further, you perform peer-reviewing activities of the work of three of your fellow learners of this MOOC. You gain the certificate if you pass all seven assignments.
Have a nice journey into the world of Econometrics!
The Econometrics team

Creating Features for Time Series Data
This course focuses on data exploration, feature creation, and feature selection for time sequences. The topics discussed include binning, smoothing, transformations, and data set operations for time series, spectral analysis, singular spectrum analysis, distance measures, and motif analysis.
In this course you learn to perform motif analysis and implement analyses in the spectral or frequency domain. You also discover how distance measures work, implement applications, explore signal components, and create time series features.
This course is appropriate for analysts with a quantitative background as well as domain experts who would like to augment their time-series tool box. Before taking this course, you should be comfortable with basic statistical concepts. You can gain this experience by completing the Statistics with SAS course. Familiarity with matrices and principal component analysis are also helpful but not required.

Building a Large-Scale, Automated Forecasting System
In this course you learn to develop and maintain a large-scale forecasting project using SAS Visual Forecasting tools. Emphasis is initially on selecting appropriate methods for data creation and variable transformations, model generation, and model selection. Then you learn how to improve overall baseline forecasting performance by modifying default processes in the system.
This course is appropriate for analysts interested in augmenting their machine learning skills with analysis tools that are appropriate for assaying, modifying, modeling, forecasting, and managing data that consist of variables that are collected over time. The courses is primarily syntax based, so analysts taking this course need some familiarity with coding. Experience with an object-oriented language is helpful, as is familiarity with manipulating large tables.

Reproducible Research
This course focuses on the concepts and tools behind reporting modern data analyses in a reproducible manner. Reproducible research is the idea that data analyses, and more generally, scientific claims, are published with their data and software code so that others may verify the findings and build upon them. The need for reproducibility is increasing dramatically as data analyses become more complex, involving larger datasets and more sophisticated computations. Reproducibility allows for people to focus on the actual content of a data analysis, rather than on superficial details reported in a written summary. In addition, reproducibility makes an analysis more useful to others because the data and code that actually conducted the analysis are available. This course will focus on literate statistical analysis tools which allow one to publish data analyses in a single document that allows others to easily execute the same analysis to obtain the same results.
Popular Internships and Jobs by Categories
Find Jobs & Internships
Browse
© 2024 BoostGrad | All rights reserved