Back to Courses




Probability And Statistics Courses - Page 8
Showing results 71-80 of 133

Machine Learning: Regression
Case Study - Predicting Housing Prices
In our first case study, predicting house prices, you will create models that predict a continuous value (price) from input features (square footage, number of bedrooms and bathrooms,...). This is just one of the many places where regression can be applied. Other applications range from predicting health outcomes in medicine, stock prices in finance, and power usage in high-performance computing, to analyzing which regulators are important for gene expression.
In this course, you will explore regularized linear regression models for the task of prediction and feature selection. You will be able to handle very large sets of features and select between models of various complexity. You will also analyze the impact of aspects of your data -- such as outliers -- on your selected models and predictions. To fit these models, you will implement optimization algorithms that scale to large datasets.
Learning Outcomes: By the end of this course, you will be able to:
-Describe the input and output of a regression model.
-Compare and contrast bias and variance when modeling data.
-Estimate model parameters using optimization algorithms.
-Tune parameters with cross validation.
-Analyze the performance of the model.
-Describe the notion of sparsity and how LASSO leads to sparse solutions.
-Deploy methods to select between models.
-Exploit the model to form predictions.
-Build a regression model to predict prices using a housing dataset.
-Implement these techniques in Python.

Network Analysis for Marketing Analytics
Network analysis is a long-standing methodology used to understand the relationships between words and actors in the broader networks in which they exist. This course covers network analysis as it pertains to marketing data, specifically text datasets and social networks. Learners walk through a conceptual overview of network analysis and dive into real-world datasets through instructor-led tutorials in Python. The course concludes with a major project.
This course can be taken for academic credit as part of CU Boulder’s Master of Science in Data Science (MS-DS) degree offered on the Coursera platform. The MS-DS is an interdisciplinary degree that brings together faculty from CU Boulder’s departments of Applied Mathematics, Computer Science, Information Science, and others. With performance-based admissions and no application process, the MS-DS is ideal for individuals with a broad range of undergraduate education and/or professional experience in computer science, information science, mathematics, and statistics. Learn more about the MS-DS program at https://www.coursera.org/degrees/master-of-science-data-science-boulder.

Portfolio Optimization using Markowitz Model
In this 1-hour long project-based course, you will learn how to optimize a two-asset portfolio at the optimum risk-to-return with finding the maximum Sharpe ratio. To achieve this, we will be working around the Sharpe ratios of two given assets, we will find the efficient frontier of these assets, and find where they intersect the best by utilizing the Markowitz Model.
The content of this course draws on the knowledge of Project: Compare Stock Returns with Google Sheets, so you are highly recommended to take it first if you are not familiar with how the Sharpe ratio is calculated and don’t have an understanding of how the risk-to-return metrics work.
Note: This course works best for learners who are based in the North America region. We're currently working on providing the same experience in other regions.
This course's content is not intended to be investment advice and does not constitute an offer to perform any operations in the regulated or unregulated financial market.

Measurement Systems Analysis
In this course, you will learn to analyze measurement systems for process stability and capability and why having a stable measurement process is imperative prior to performing any statistical analysis. You will analyze continuous measurement systems and statistically characterize both accuracy and precision using R software. You will perform measurement systems analysis for potential, short-term and long-term statistical control and capability. Additionally, you will learn how to assess a discrete measurement and perform analyses for internal consistency, concordance between assessors, and concordance with a standard. Finally, you will learn how to make decisions on measurement systems process improvement.
This specialization can be taken for academic credit as part of CU Boulder’s Master of Science in Data Science (MS-DS) degree offered on the Coursera platform. The MS-DS is an interdisciplinary degree that brings together faculty from CU Boulder’s departments of Applied Mathematics, Computer Science, Information Science, and others. With performance-based admissions and no application process, the MS-DS is ideal for individuals with a broad range of undergraduate education and/or professional experience in computer science, information science, mathematics, and statistics. Learn more about the MS-DS program at https://www.coursera.org/degrees/master-of-science-data-science-boulder.

Simple Regression Analysis in Public Health
Biostatistics is the application of statistical reasoning to the life sciences, and it's the key to unlocking the data gathered by researchers and the evidence presented in the scientific public health literature. In this course, we'll focus on the use of simple regression methods to determine the relationship between an outcome of interest and a single predictor via a linear equation. Along the way, you'll be introduced to a variety of methods, and you'll practice interpreting data and performing calculations on real data from published studies. Topics include logistic regression, confidence intervals, p-values, Cox regression, confounding, adjustment, and effect modification.

Crash Course on Interactive Data Visualization with Plotly
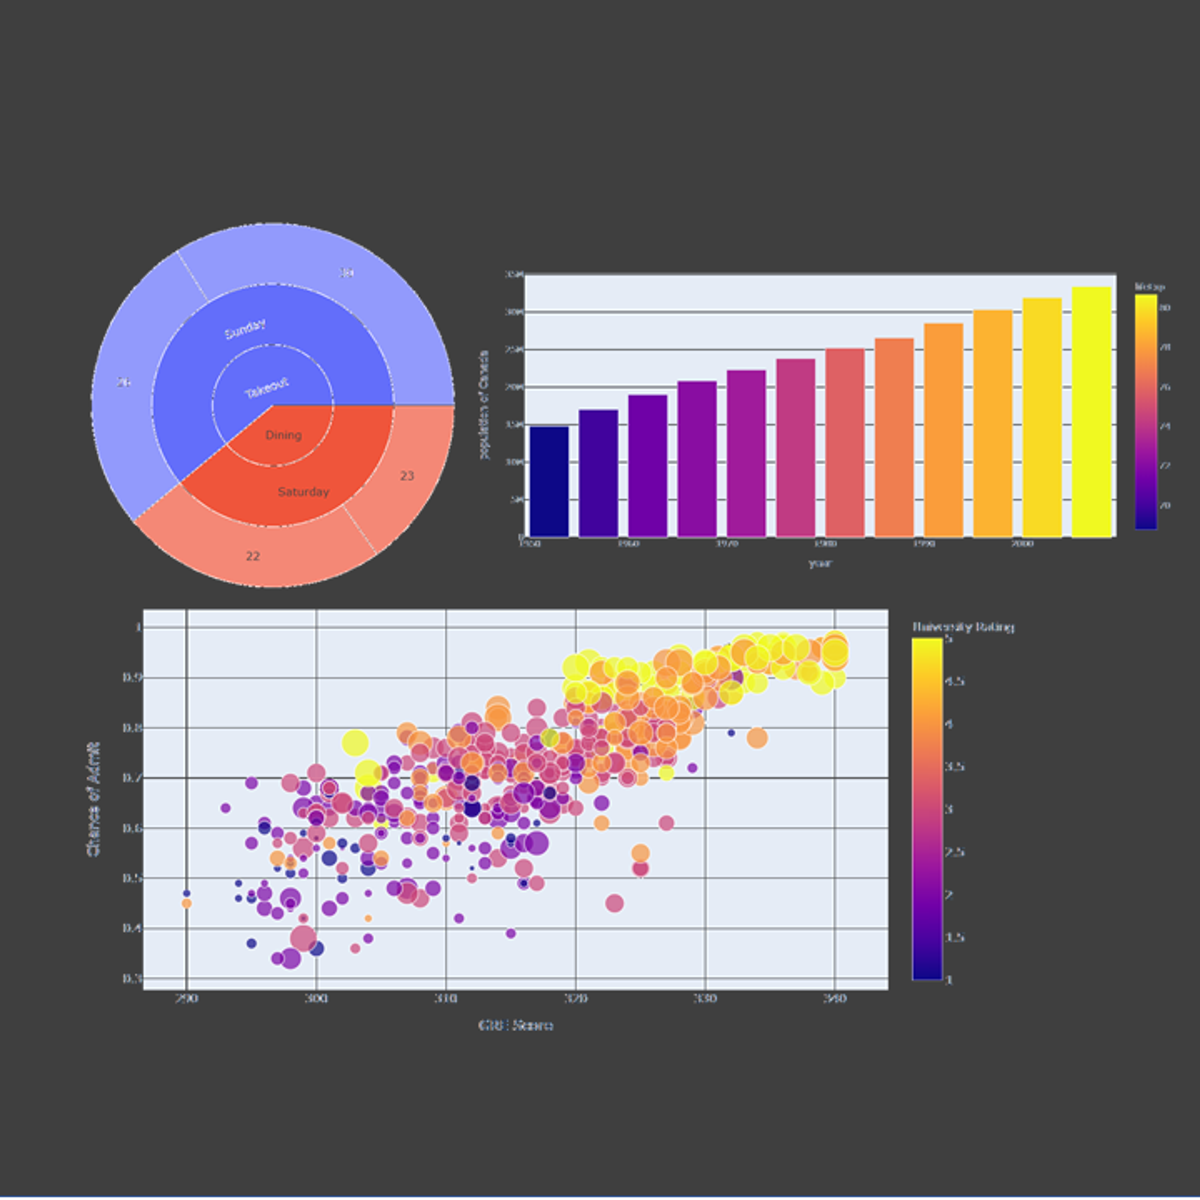
In this hands-on project, we will understand the fundamentals of interactive data visualization using Plolty Express. Plotly Express is a powerful Python package that empowers anyone to create, manipulate and render graphical figures with very few lines of code. Plotly Express is the recommended entry-point into the plotly package. We will leverage Plotly Express to generate interactive single Line plots, multiple line plots, histograms, pie charts, scatterplots, bubble charts, and bar charts.
Note: This course works best for learners who are based in the North America region. We’re currently working on providing the same experience in other regions.

R Programming
In this course you will learn how to program in R and how to use R for effective data analysis. You will learn how to install and configure software necessary for a statistical programming environment and describe generic programming language concepts as they are implemented in a high-level statistical language. The course covers practical issues in statistical computing which includes programming in R, reading data into R, accessing R packages, writing R functions, debugging, profiling R code, and organizing and commenting R code. Topics in statistical data analysis will provide working examples.

Data Visualization
Learn the general concepts of data mining along with basic methodologies and applications. Then dive into one subfield in data mining: pattern discovery. Learn in-depth concepts, methods, and applications of pattern discovery in data mining. We will also introduce methods for pattern-based classification and some interesting applications of pattern discovery. This course provides you the opportunity to learn skills and content to practice and engage in scalable pattern discovery methods on massive transactional data, discuss pattern evaluation measures, and study methods for mining diverse kinds of patterns, sequential patterns, and sub-graph patterns.

Data Science Ethics
What are the ethical considerations regarding the privacy and control of consumer information and big data, especially in the aftermath of recent large-scale data breaches?
This course provides a framework to analyze these concerns as you examine the ethical and privacy implications of collecting and managing big data. Explore the broader impact of the data science field on modern society and the principles of fairness, accountability and transparency as you gain a deeper understanding of the importance of a shared set of ethical values. You will examine the need for voluntary disclosure when leveraging metadata to inform basic algorithms and/or complex artificial intelligence systems while also learning best practices for responsible data management, understanding the significance of the Fair Information Practices Principles Act and the laws concerning the "right to be forgotten."
This course will help you answer questions such as who owns data, how do we value privacy, how to receive informed consent and what it means to be fair.
Data scientists and anyone beginning to use or expand their use of data will benefit from this course. No particular previous knowledge needed.

Experimentation for Improvement
We are always using experiments to improve our lives, our community, and our work. Are you doing it efficiently? Or are you (incorrectly) changing one thing at a time and hoping for the best?
In this course, you will learn how to plan efficient experiments - testing with many variables. Our goal is to find the best results using only a few experiments. A key part of the course is how to optimize a system.
We use simple tools: starting with fast calculations by hand, then we show how to use FREE software.
The course comes with slides, transcripts of all lectures, subtitles (English, Spanish and Portuguese; some Chinese and French), videos, audio files, source code, and a free textbook. You get to keep all of it, all freely downloadable.
This course is for anyone working in a company, or wanting to make changes to their life, their community, their neighbourhood. You don't need to be a statistician or scientist! There's something for everyone in here.
⎯⎯⎯⎯⎯⎯⎯⎯⎯⎯⎯⎯⎯⎯⎯
Over 1500 people have completed this online course. What have prior students said about this course?
"This definitely is one of the most fruitful courses I have participated at Coursera, considering the takeaways and implementations! And so far I finished 12 [courses]."
"Excelente curso, flexible y con suficiente material didáctico fácilmente digerible y cómodo. No importa si se tiene pocas bases matemáticas o estadísticas, el curso proporciona casi toda explicación necesaria para un entendimiento alto."
"I wish I had enrolled in your course years ago -- it would have saved us a lot of time in optimizing experimental conditions." Jason Eriksen, 3 Jan 2017
"Interesting and developing both analytical and creative thinking. The lecturer took care to bring lots of real live examples which are fun to analyze." 20 February 2016.
"... love your style of presentation, and the examples you took from everyday life to explain things. It is very difficult to make such a mathematical course accessible and comprehensible to this wide a variety of people!"
⎯⎯⎯⎯⎯⎯⎯⎯⎯⎯⎯⎯⎯⎯⎯
Popular Internships and Jobs by Categories
Find Jobs & Internships
Browse
© 2024 BoostGrad | All rights reserved