Back to Courses






Probability And Statistics Courses - Page 7
Showing results 61-70 of 133

BigQuery Soccer Data Analytical Insight
This is a self-paced lab that takes place in the Google Cloud console. Learn how to create deeper analytical insights from soccer event data using BigQuery.
BigQuery can be used to perform more sophisticated data analysis. In this lab, you will analyze soccer event data to achieve real insight from the dataset.

Modern Regression Analysis in R
This course will provide a set of foundational statistical modeling tools for data science. In particular, students will be introduced to methods, theory, and applications of linear statistical models, covering the topics of parameter estimation, residual diagnostics, goodness of fit, and various strategies for variable selection and model comparison. Attention will also be given to the misuse of statistical models and ethical implications of such misuse.
This course can be taken for academic credit as part of CU Boulder’s Master of Science in Data Science (MS-DS) degree offered on the Coursera platform. The MS-DS is an interdisciplinary degree that brings together faculty from CU Boulder’s departments of Applied Mathematics, Computer Science, Information Science, and others. With performance-based admissions and no application process, the MS-DS is ideal for individuals with a broad range of undergraduate education and/or professional experience in computer science, information science, mathematics, and statistics. Learn more about the MS-DS program at https://www.coursera.org/degrees/master-of-science-data-science-boulder.
Logo adapted from photo by Vincent Ledvina on Unsplash

Probabilistic Deep Learning with TensorFlow 2
Welcome to this course on Probabilistic Deep Learning with TensorFlow!
This course builds on the foundational concepts and skills for TensorFlow taught in the first two courses in this specialisation, and focuses on the probabilistic approach to deep learning. This is an increasingly important area of deep learning that aims to quantify the noise and uncertainty that is often present in real world datasets. This is a crucial aspect when using deep learning models in applications such as autonomous vehicles or medical diagnoses; we need the model to know what it doesn't know.
You will learn how to develop probabilistic models with TensorFlow, making particular use of the TensorFlow Probability library, which is designed to make it easy to combine probabilistic models with deep learning. As such, this course can also be viewed as an introduction to the TensorFlow Probability library.
You will learn how probability distributions can be represented and incorporated into deep learning models in TensorFlow, including Bayesian neural networks, normalising flows and variational autoencoders. You will learn how to develop models for uncertainty quantification, as well as generative models that can create new samples similar to those in the dataset, such as images of celebrity faces.
You will put concepts that you learn about into practice straight away in practical, hands-on coding tutorials, which you will be guided through by a graduate teaching assistant. In addition there is a series of automatically graded programming assignments for you to consolidate your skills.
At the end of the course, you will bring many of the concepts together in a Capstone Project, where you will develop a variational autoencoder algorithm to produce a generative model of a synthetic image dataset that you will create yourself.
This course follows on from the previous two courses in the specialisation, Getting Started with TensorFlow 2 and Customising Your Models with TensorFlow 2. The additional prerequisite knowledge required in order to be successful in this course is a solid foundation in probability and statistics. In particular, it is assumed that you are familiar with standard probability distributions, probability density functions, and concepts such as maximum likelihood estimation, change of variables formula for random variables, and the evidence lower bound (ELBO) used in variational inference.

Financial Risk Management with R
This course teaches you how to calculate the return of a portfolio of securities as well as quantify the market risk of that portfolio, an important skill for financial market analysts in banks, hedge funds, insurance companies, and other financial services and investment firms. Using the R programming language with Microsoft Open R and RStudio, you will use the two main tools for calculating the market risk of stock portfolios: Value-at-Risk (VaR) and Expected Shortfall (ES). You will need a beginner-level understanding of R programming to complete the assignments of this course.

Getting Started with Tidyverse
In this project, you will learn about Tidyverse, a system of packages for data manipulation, exploration and visualization in the R programming language. R is a computer programming language, and it is also an open-source software often used among data scientists, statisticians, and data miners in their everyday work with data sets.

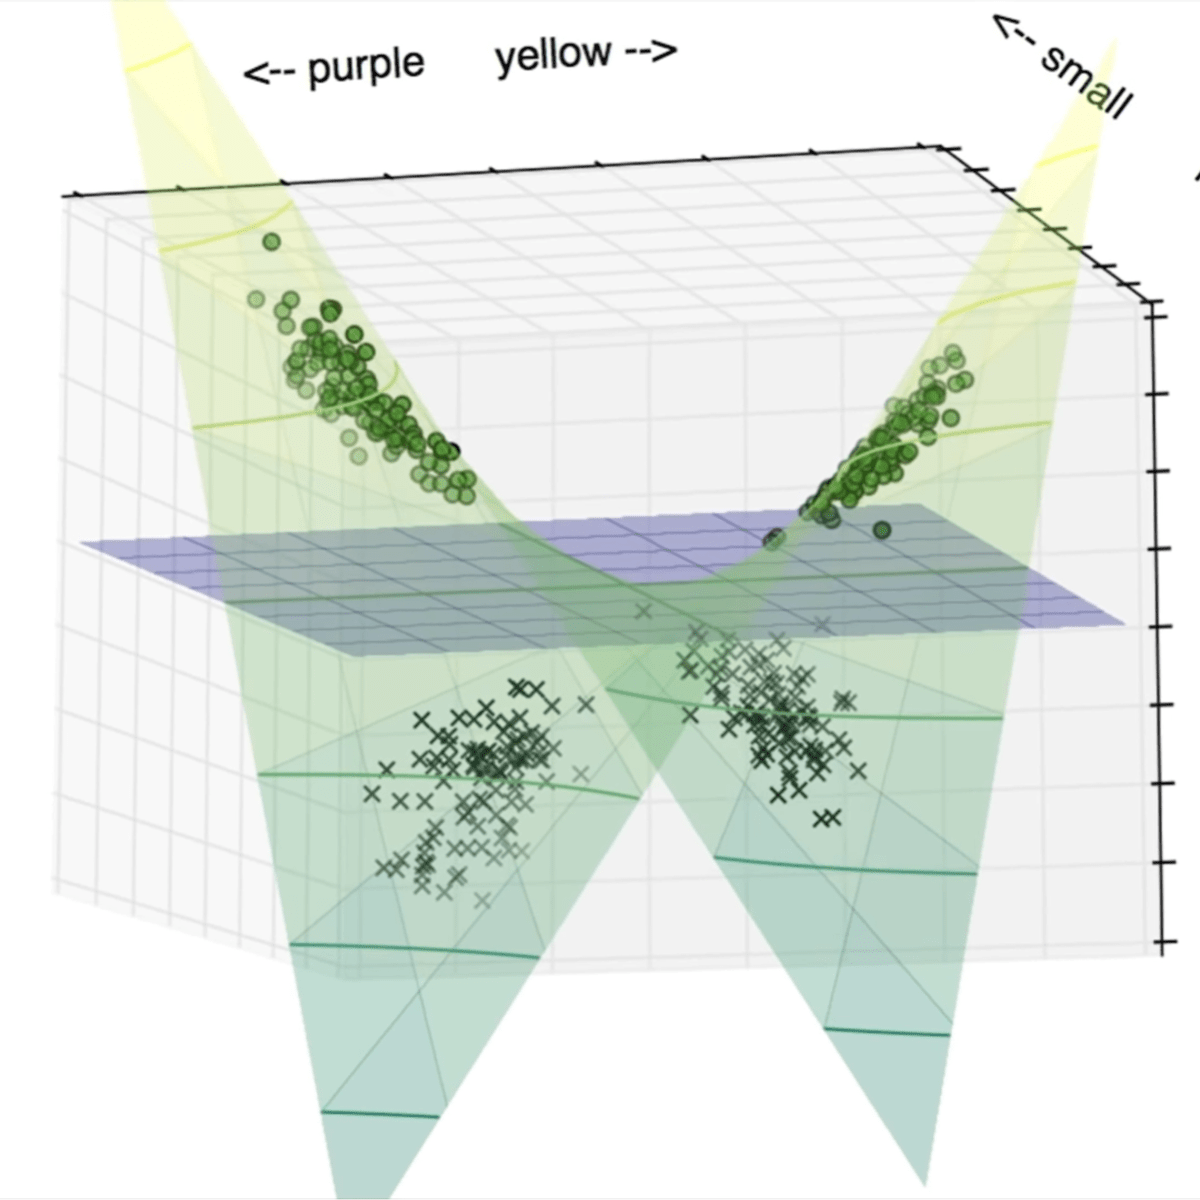
Non Linear SVM Classification -using SCKIT learn
Non Linear SVM Classification -using SCKIT learn

Bayesian Statistics: Techniques and Models
This is the second of a two-course sequence introducing the fundamentals of Bayesian statistics. It builds on the course Bayesian Statistics: From Concept to Data Analysis, which introduces Bayesian methods through use of simple conjugate models. Real-world data often require more sophisticated models to reach realistic conclusions. This course aims to expand our “Bayesian toolbox” with more general models, and computational techniques to fit them. In particular, we will introduce Markov chain Monte Carlo (MCMC) methods, which allow sampling from posterior distributions that have no analytical solution. We will use the open-source, freely available software R (some experience is assumed, e.g., completing the previous course in R) and JAGS (no experience required). We will learn how to construct, fit, assess, and compare Bayesian statistical models to answer scientific questions involving continuous, binary, and count data. This course combines lecture videos, computer demonstrations, readings, exercises, and discussion boards to create an active learning experience. The lectures provide some of the basic mathematical development, explanations of the statistical modeling process, and a few basic modeling techniques commonly used by statisticians. Computer demonstrations provide concrete, practical walkthroughs. Completion of this course will give you access to a wide range of Bayesian analytical tools, customizable to your data.

Mastering Data Analysis with Pandas: Learning Path Part 2
In this structured series of hands-on guided projects, we will master the fundamentals of data analysis and manipulation with Pandas and Python. Pandas is a super powerful, fast, flexible and easy to use open-source data analysis and manipulation tool. This guided project is the second of a series of multiple guided projects (learning path) that is designed for anyone who wants to master data analysis with pandas.
Note: This course works best for learners who are based in the North America region. We’re currently working on providing the same experience in other regions.

Summary Statistics in Public Health
Biostatistics is the application of statistical reasoning to the life sciences, and it is the key to unlocking the data gathered by researchers and the evidence presented in the scientific literature. In this course, we'll focus on the use of statistical measurement methods within the world of public health research. Along the way, you'll be introduced to a variety of methods and measures, and you'll practice interpreting data and performing calculations on real data from published studies. Topics include summary measures, visual displays, continuous data, sample size, the normal distribution, binary data, the element of time, and the Kaplan-Meir curve.

Fitting Statistical Models to Data with Python
In this course, we will expand our exploration of statistical inference techniques by focusing on the science and art of fitting statistical models to data. We will build on the concepts presented in the Statistical Inference course (Course 2) to emphasize the importance of connecting research questions to our data analysis methods. We will also focus on various modeling objectives, including making inference about relationships between variables and generating predictions for future observations.
This course will introduce and explore various statistical modeling techniques, including linear regression, logistic regression, generalized linear models, hierarchical and mixed effects (or multilevel) models, and Bayesian inference techniques. All techniques will be illustrated using a variety of real data sets, and the course will emphasize different modeling approaches for different types of data sets, depending on the study design underlying the data (referring back to Course 1, Understanding and Visualizing Data with Python).
During these lab-based sessions, learners will work through tutorials focusing on specific case studies to help solidify the week’s statistical concepts, which will include further deep dives into Python libraries including Statsmodels, Pandas, and Seaborn. This course utilizes the Jupyter Notebook environment within Coursera.
Popular Internships and Jobs by Categories
Find Jobs & Internships
Browse
© 2024 BoostGrad | All rights reserved