Back to Courses


Probability And Statistics Courses - Page 10
Showing results 91-100 of 133

Statistical Inference and Hypothesis Testing in Data Science Applications
This course will focus on theory and implementation of hypothesis testing, especially as it relates to applications in data science. Students will learn to use hypothesis tests to make informed decisions from data. Special attention will be given to the general logic of hypothesis testing, error and error rates, power, simulation, and the correct computation and interpretation of p-values. Attention will also be given to the misuse of testing concepts, especially p-values, and the ethical implications of such misuse.
This course can be taken for academic credit as part of CU Boulder’s Master of Science in Data Science (MS-DS) degree offered on the Coursera platform. The MS-DS is an interdisciplinary degree that brings together faculty from CU Boulder’s departments of Applied Mathematics, Computer Science, Information Science, and others. With performance-based admissions and no application process, the MS-DS is ideal for individuals with a broad range of undergraduate education and/or professional experience in computer science, information science, mathematics, and statistics. Learn more about the MS-DS program at https://www.coursera.org/degrees/master-of-science-data-science-boulder.

BigQuery Soccer Data Ingestion
This is a self-paced lab that takes place in the Google Cloud console. Get started with sports data science by importing soccer data on matches, teams, players, and match events into BigQuery tables.
Information access uses multiple formats, and BigQuery makes working with multiple data sources simple. In this lab you will get started with sports data science by importing external sports data sources into BigQuery tables. This will give you the basis for building more sophisticated analytics in subsequent labs.

Survival Analysis in R for Public Health
Welcome to Survival Analysis in R for Public Health!
The three earlier courses in this series covered statistical thinking, correlation, linear regression and logistic regression. This one will show you how to run survival – or “time to event” – analysis, explaining what’s meant by familiar-sounding but deceptive terms like hazard and censoring, which have specific meanings in this context. Using the popular and completely free software R, you’ll learn how to take a data set from scratch, import it into R, run essential descriptive analyses to get to know the data’s features and quirks, and progress from Kaplan-Meier plots through to multiple Cox regression. You’ll use data simulated from real, messy patient-level data for patients admitted to hospital with heart failure and learn how to explore which factors predict their subsequent mortality. You’ll learn how to test model assumptions and fit to the data and some simple tricks to get round common problems that real public health data have. There will be mini-quizzes on the videos and the R exercises with feedback along the way to check your understanding.
Prerequisites
Some formulae are given to aid understanding, but this is not one of those courses where you need a mathematics degree to follow it. You will need basic numeracy (for example, we will not use calculus) and familiarity with graphical and tabular ways of presenting results. The three previous courses in the series explained concepts such as hypothesis testing, p values, confidence intervals, correlation and regression and showed how to install R and run basic commands. In this course, we will recap all these core ideas in brief, but if you are unfamiliar with them, then you may prefer to take the first course in particular, Statistical Thinking in Public Health, and perhaps also the second, on linear regression, before embarking on this one.

Exploring NCAA Data with BigQuery
This is a self-paced lab that takes place in the Google Cloud console.
Use BigQuery to explore the NCAA dataset of basketball games, teams, and players. The data covers plays from 2009 and scores from 1996. Watch <A HREF="https://youtu.be/xDZjcfMm-t8">How the NCAA is using Google Cloud to tap into decades of sports data</A>.

Basic Statistics
Understanding statistics is essential to understand research in the social and behavioral sciences. In this course you will learn the basics of statistics; not just how to calculate them, but also how to evaluate them. This course will also prepare you for the next course in the specialization - the course Inferential Statistics.
In the first part of the course we will discuss methods of descriptive statistics. You will learn what cases and variables are and how you can compute measures of central tendency (mean, median and mode) and dispersion (standard deviation and variance). Next, we discuss how to assess relationships between variables, and we introduce the concepts correlation and regression.
The second part of the course is concerned with the basics of probability: calculating probabilities, probability distributions and sampling distributions. You need to know about these things in order to understand how inferential statistics work.
The third part of the course consists of an introduction to methods of inferential statistics - methods that help us decide whether the patterns we see in our data are strong enough to draw conclusions about the underlying population we are interested in. We will discuss confidence intervals and significance tests.
You will not only learn about all these statistical concepts, you will also be trained to calculate and generate these statistics yourself using freely available statistical software.

Data and Statistics Foundation for Investment Professionals
Aimed at investment professionals or those with investment industry knowledge, this course offers an introduction to the basic data and statistical techniques that underpin data analysis and lays an essential foundation in the techniques that are used in big data and machine learning. It introduces the topics and gives practical examples of how they are used by investment professionals, including the importance of presenting the “data story" by using appropriate visualizations and report writing.
In this course you will learn how to:
- Explain basic statistical measures and their application to real-life data sets
- Calculate and interpret measures of dispersion and explain deviations from a normal distribution
- Understand the use and appropriateness of different distributions
- Compare and contrast ways of visualizing data and create them using Python (no prior knowledge of Python necessary)
- Explain sampling theory and draw inferences about population parameters from sample statistics
- Formulate hypotheses on investment problems
This course is part of the Data Science for Investment Professionals Specialization offered by CFA Institute.

Factorial and Fractional Factorial Designs
Many experiments in engineering, science and business involve several factors. This course is an introduction to these types of multifactor experiments. The appropriate experimental strategy for these situations is based on the factorial design, a type of experiment where factors are varied together. This course focuses on designing these types of experiments and on using the ANOVA for analyzing the resulting data. These types of experiments often include nuisance factors, and the blocking principle can be used in factorial designs to handle these situations. As the number of factors of interest grows full factorials become too expensive and fractional versions of the factorial design are useful. This course will cover the benefits of fractional factorials, along with methods for constructing and analyzing the data from these experiments.

An Intuitive Introduction to Probability
This course will provide you with a basic, intuitive and practical introduction into Probability Theory. You will be able to learn how to apply Probability Theory in different scenarios and you will earn a "toolbox" of methods to deal with uncertainty in your daily life.
The course is split in 5 modules. In each module you will first have an easy introduction into the topic, which will serve as a basis to further develop your knowledge about the topic and acquire the "tools" to deal with uncertainty. Additionally, you will have the opportunity to complete 5 exercise sessions to reflect about the content learned in each module and start applying your earned knowledge right away.
The topics covered are: "Probability", "Conditional Probability", "Applications", "Random Variables", and "Normal Distribution".
You will see how the modules are taught in a lively way, focusing on having an entertaining and useful learning experience! We are looking forward to see you online!

Experimental Design Basics
This is a basic course in designing experiments and analyzing the resulting data. The course objective is to learn how to plan, design and conduct experiments efficiently and effectively, and analyze the resulting data to obtain objective conclusions. Both design and statistical analysis issues are discussed. Opportunities to use the principles taught in the course arise in all aspects of today’s industrial and business environment. Applications from various fields will be illustrated throughout the course. Computer software packages (JMP, Design-Expert, Minitab) will be used to implement the methods presented and will be illustrated extensively.
All experiments are designed experiments; some of them are poorly designed, and others are well-designed. Well-designed experiments allow you to obtain reliable, valid results faster, easier, and with fewer resources than with poorly-designed experiments. You will learn how to plan, conduct and analyze experiments efficiently in this course.

Using probability distributions for real world problems in R
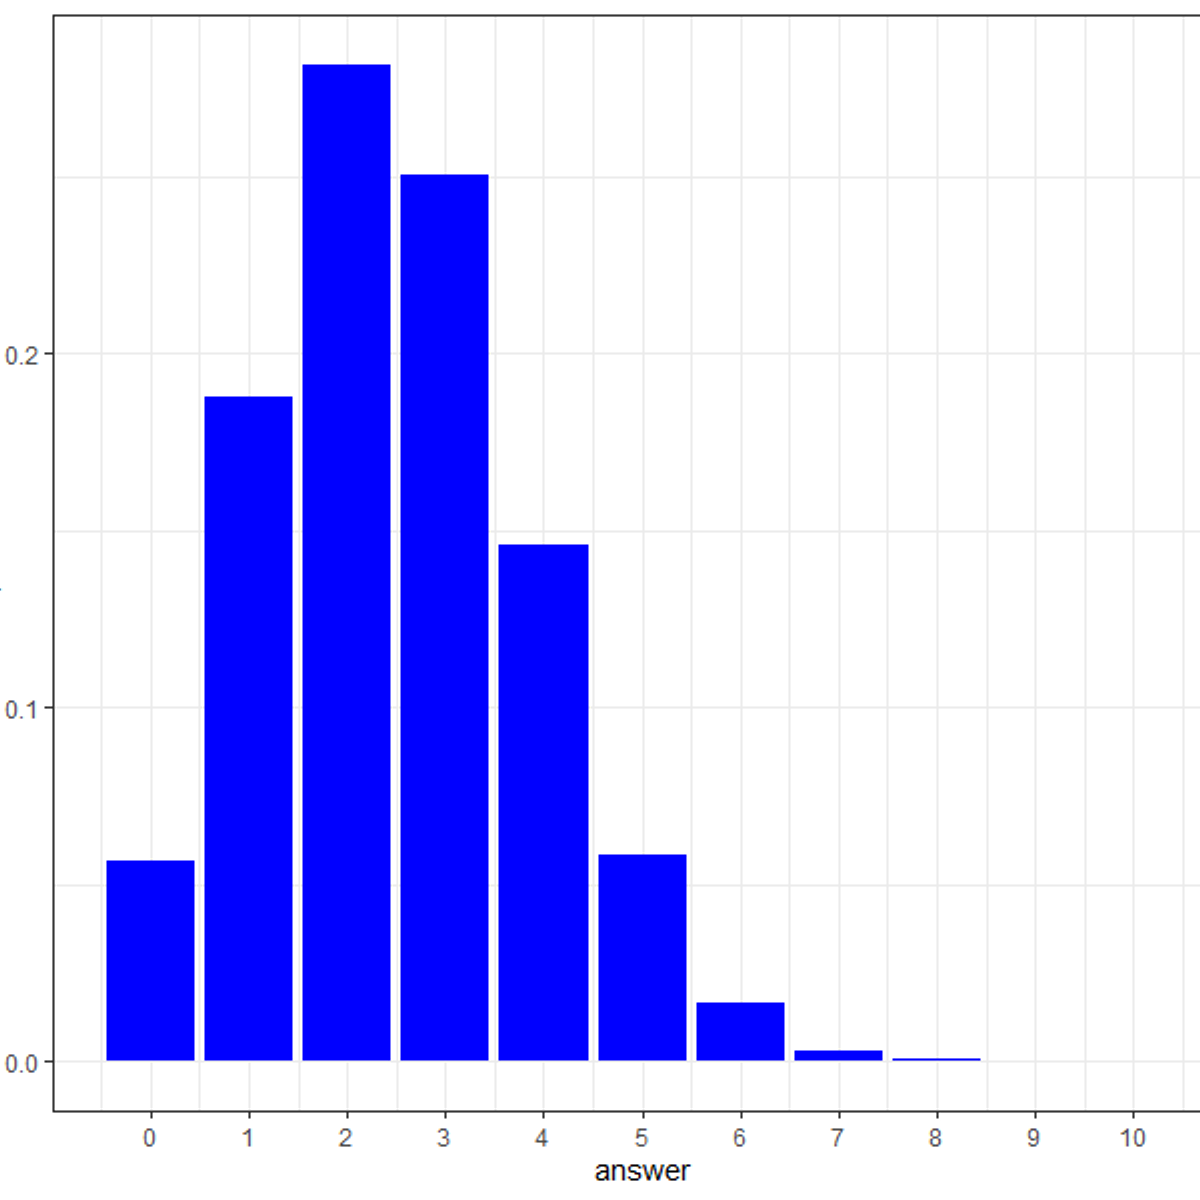
By the end of this project, you will learn how to apply probability distributions to solve real world problems in R, a free, open-source program that you can download. You will learn how to answer real world problems using the following probability distributions – Binomial, Poisson, Normal, Exponential and Chi-square. You will also learn the various ways of visualizing these distributions of real world problems. By the end of this project, you will become confident in understanding commonly used probability distributions through solving practical problems and you will strengthen your core concepts of data distributions using R programming language.
These distributions are widely used in day-to-day life of statisticians for hypothesis testing and drawing conclusions on a population from a small sample. Additionally, in the field of data science, statistical inferences use probability distribution of data to analyze or predict trend from data.
Note: This course works best for learners who are based in the North America region. We’re currently working on providing the same experience in other regions.
Popular Internships and Jobs by Categories
Find Jobs & Internships
Browse
© 2024 BoostGrad | All rights reserved