Back to Courses


Probability And Statistics Courses - Page 12
Showing results 111-120 of 133

Modeling Time Series and Sequential Data
In this course you learn to build, refine, extrapolate, and, in some cases, interpret models designed for a single, sequential series. There are three modeling approaches presented. The traditional, Box-Jenkins approach for modeling time series is covered in the first part of the course. This presentation moves students from models for stationary data, or ARMA, to models for trend and seasonality, ARIMA, and concludes with information about specifying transfer function components in an ARIMAX, or time series regression, model. A Bayesian approach to modeling time series is considered next. The basic Bayesian framework is extended to accommodate autoregressive variation in the data as well as dynamic input variable effects. Machine learning algorithms for time series is the third approach. Gradient boosting and recurrent neural network algorithms are particularly well suited for accommodating nonlinear relationships in the data. Examples are provided to build intuition on the effective use of these algorithms.
The course concludes by considering how forecasting precision can be improved by combining the strengths of the different approaches. The final lesson includes demonstrations on creating combined (or ensemble) and hybrid model forecasts.
This course is appropriate for analysts interested in augmenting their machine learning skills with analysis tools that are appropriate for assaying, modifying, modeling, forecasting, and managing data that consist of variables that are collected over time.
This course uses a variety of different software tools. Familiarity with Base SAS, SAS/ETS, SAS/STAT, and SAS Visual Forecasting, as well as open-source tools for sequential data handling and modeling, is helpful but not required. The lessons on Bayesian analysis and machine learning models assume some prior knowledge of these topics. One way that students can acquire this background is by completing these SAS Education courses: Bayesian Analyses Using SAS and Machine Learning Using SAS Viya.

Statistics for Genomic Data Science
An introduction to the statistics behind the most popular genomic data science projects. This is the sixth course in the Genomic Big Data Science Specialization from Johns Hopkins University.

Advanced Linear Models for Data Science 1: Least Squares
Welcome to the Advanced Linear Models for Data Science Class 1: Least Squares. This class is an introduction to least squares from a linear algebraic and mathematical perspective. Before beginning the class make sure that you have the following:
- A basic understanding of linear algebra and multivariate calculus.
- A basic understanding of statistics and regression models.
- At least a little familiarity with proof based mathematics.
- Basic knowledge of the R programming language.
After taking this course, students will have a firm foundation in a linear algebraic treatment of regression modeling. This will greatly augment applied data scientists' general understanding of regression models.

Game Theory with Python
In this 2-hour long project-based course, you will learn the game theoretic concepts of Two player Static and Dynamic Games, Pure and Mixed strategy Nash Equilibria for static games (illustrations with unique and multiple solutions), Example of Axelrod tournament. You will be building two player Nash games and analyze them using Python packages Nashpy and Axelrod, especially built for game theoretic analyses. Also, you will gain the understanding of computational mechanisms related to the aforementioned concepts.
Note: This course works best for learners who are based in the North America region. We’re currently working on providing the same experience in other regions.

Forecasting US Presidential Elections with Mixed Models
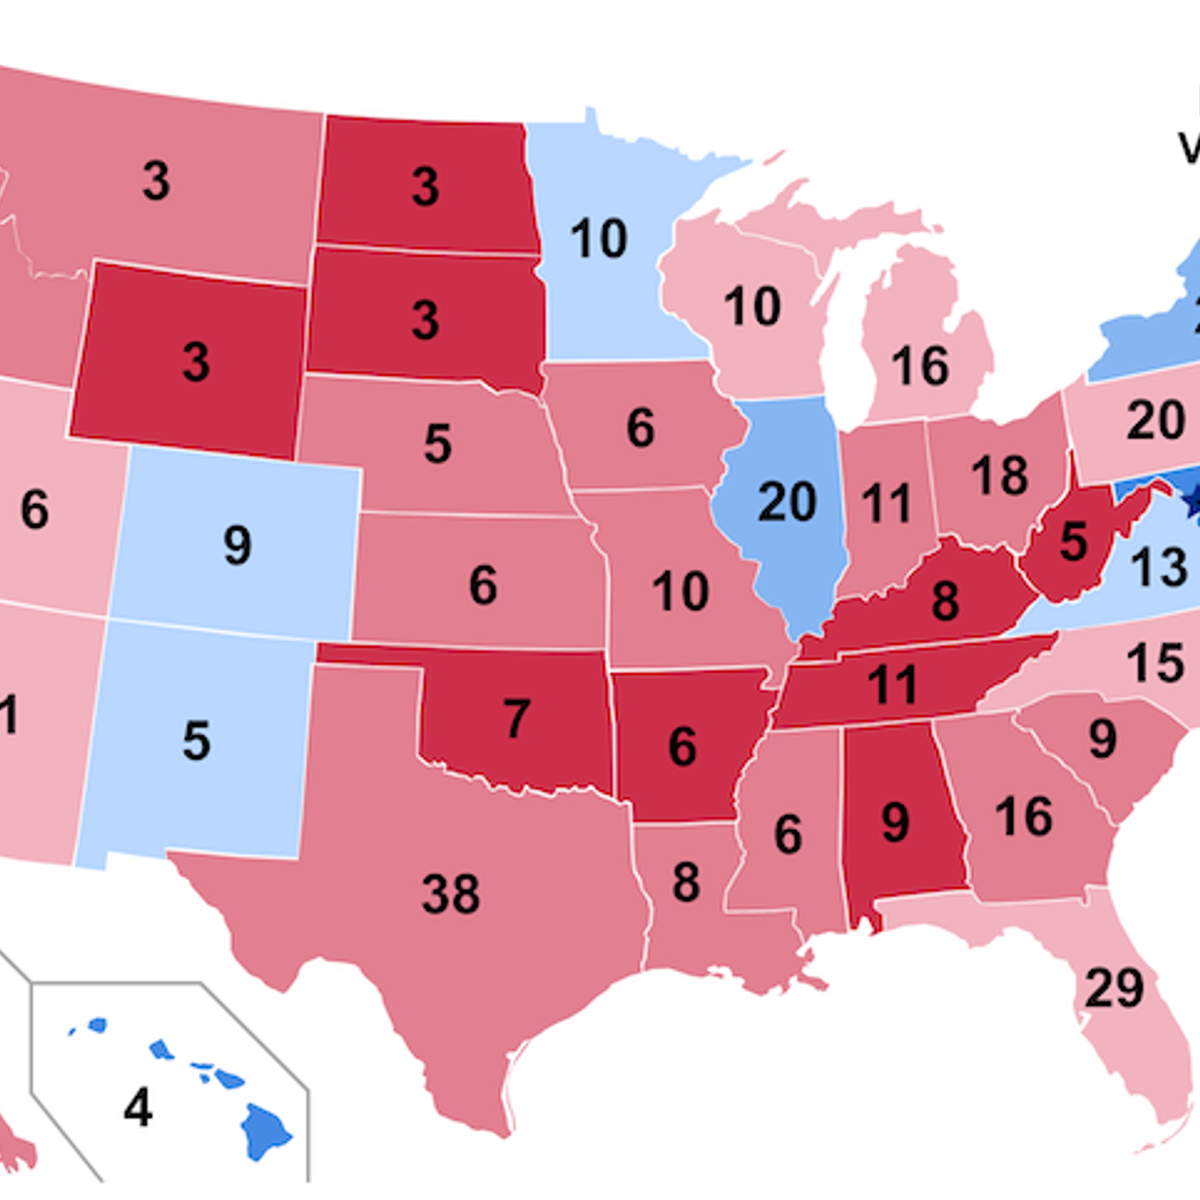
In this project-based course, you will learn how to forecast US Presidential Elections. We will use mixed effects models in the R programming language to build a forecasting model for the 2020 election. The project will review how the US selects Presidents in the Electoral College, stylized facts about voting trends, the basics of mixed effects models, and how to use them in forecasting.

Mastering Data Analysis with Pandas: Learning Path Part 5
In this structured series of hands-on guided projects, we will master the fundamentals of data analysis and manipulation with Pandas and Python. Pandas is a super powerful, fast, flexible and easy to use open-source data analysis and manipulation tool. This guided project is the fifth of a series of multiple guided projects (learning path) that is designed for anyone who wants to master data analysis with pandas.
Note: This course works best for learners who are based in the North America region. We’re currently working on providing the same experience in other regions.

Statistical Thinking for Industrial Problem Solving, presented by JMP
Statistical Thinking for Industrial Problem Solving is an applied statistics course for scientists and engineers offered by JMP, a division of SAS. By completing this course, students will understand the importance of statistical thinking, and will be able to use data and basic statistical methods to solve many real-world problems. Students completing this course will be able to:
• Explain the importance of statistical thinking in solving problems
• Describe the importance of data, and the steps needed to compile and prepare data for analysis
• Compare core methods for summarizing, exploring and analyzing data, and describe when to apply these methods
• Recognize the importance of statistically designed experiments in understanding cause and effect

Simulation Models for Decision Making
This course is primarily aimed at third- and fourth-year undergraduate students or graduate students interested in learning simulation techniques to solve business problems.
The course will introduce you to take everyday and complex business problems that have no one correct answer due to uncertainties that exist in business environments. Simulation modeling allows us to explore various outcomes and protect personal or business interests against unwanted outcomes. We can model uncertainties by using the concepts of probability and stepwise thinking. Stepwise thinking allows us to break down the problem in smaller components, explore dependencies between related events and allows us to focus on aspects of problem that are prone to changes due to future uncertainties.
The course will introduce you to advanced Excel techniques to model and execute simulation models. Many of the Excel techniques learned in the course will be useful beyond simulation modeling. We will learn both Monte Carlo simulation techniques where overall outcome is of primary interest and discrete event simulation where intermediate dependencies between related events might be of interest. The course will introduce you to several practical issues in simulation modeling that are normally not covered in textbooks. The course uses a few running examples throughout the course to demonstrate concepts and provide concrete modeling examples.
After taking the course a student will be able to develop fairly advanced simulation models to explore fairly broad range of business environments and outcomes.

Improving your statistical inferences
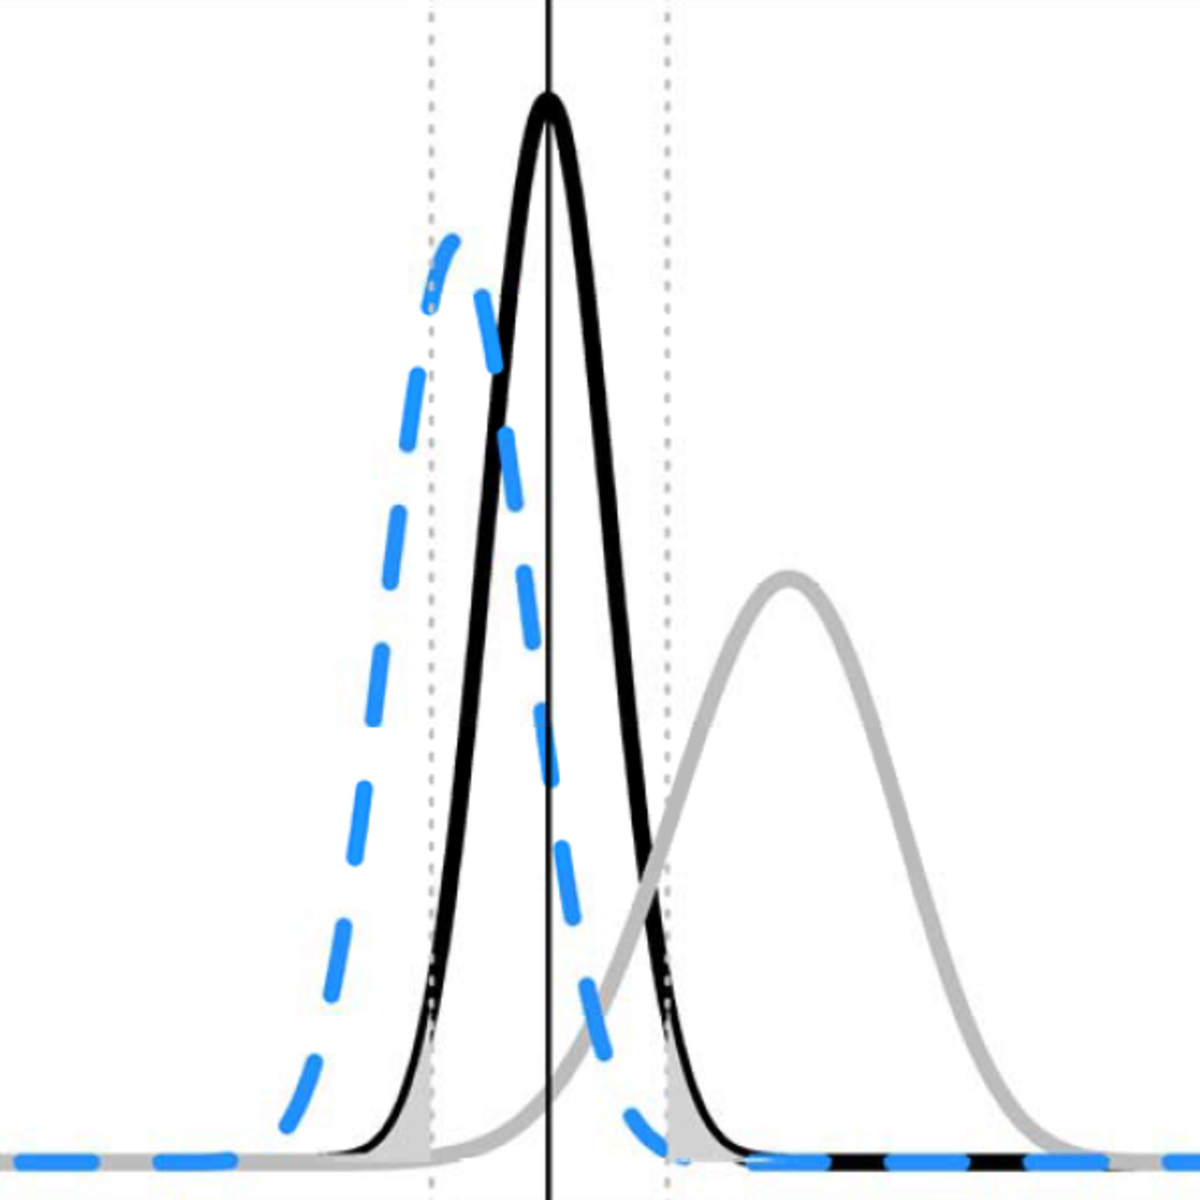
This course aims to help you to draw better statistical inferences from empirical research. First, we will discuss how to correctly interpret p-values, effect sizes, confidence intervals, Bayes Factors, and likelihood ratios, and how these statistics answer different questions you might be interested in. Then, you will learn how to design experiments where the false positive rate is controlled, and how to decide upon the sample size for your study, for example in order to achieve high statistical power. Subsequently, you will learn how to interpret evidence in the scientific literature given widespread publication bias, for example by learning about p-curve analysis. Finally, we will talk about how to do philosophy of science, theory construction, and cumulative science, including how to perform replication studies, why and how to pre-register your experiment, and how to share your results following Open Science principles.
In practical, hands on assignments, you will learn how to simulate t-tests to learn which p-values you can expect, calculate likelihood ratio's and get an introduction the binomial Bayesian statistics, and learn about the positive predictive value which expresses the probability published research findings are true. We will experience the problems with optional stopping and learn how to prevent these problems by using sequential analyses. You will calculate effect sizes, see how confidence intervals work through simulations, and practice doing a-priori power analyses. Finally, you will learn how to examine whether the null hypothesis is true using equivalence testing and Bayesian statistics, and how to pre-register a study, and share your data on the Open Science Framework.
All videos now have Chinese subtitles. More than 30.000 learners have enrolled so far!
If you enjoyed this course, I can recommend following it up with me new course "Improving Your Statistical Questions"

Regression Modeling in Practice
This course focuses on one of the most important tools in your data analysis arsenal: regression analysis. Using either SAS or Python, you will begin with linear regression and then learn how to adapt when two variables do not present a clear linear relationship. You will examine multiple predictors of your outcome and be able to identify confounding variables, which can tell a more compelling story about your results. You will learn the assumptions underlying regression analysis, how to interpret regression coefficients, and how to use regression diagnostic plots and other tools to evaluate the quality of your regression model. Throughout the course, you will share with others the regression models you have developed and the stories they tell you.
Popular Internships and Jobs by Categories
Find Jobs & Internships
Browse
© 2024 BoostGrad | All rights reserved