Back to Courses







Probability And Statistics Courses - Page 13
Showing results 121-130 of 133

Bayesian Statistics: Capstone Project
This is the capstone project for UC Santa Cruz's Bayesian Statistics Specialization. It is an opportunity for you to demonstrate a wide range of skills and knowledge in Bayesian statistics and to apply what you know to real-world data. You will review essential concepts in Bayesian statistics with lecture videos and quizzes, and you will perform a complex data analysis and compose a report on your methods and results.

Introduction to Microsoft Excel
At the end of this project, you will be able to start a simple spreadsheet in Microsoft Excel. Being able to use Microsoft Excel will allow you to simplify many of your daily tasks at work but also at home. There is no limit to what you can use Microsoft Excel for, you can use it to plan the annual budget of your business, you can use it to track business expenses but you can also use it simply to keep inventory of all the books you own.

Basic Statistics in Python (Correlations and T-tests)
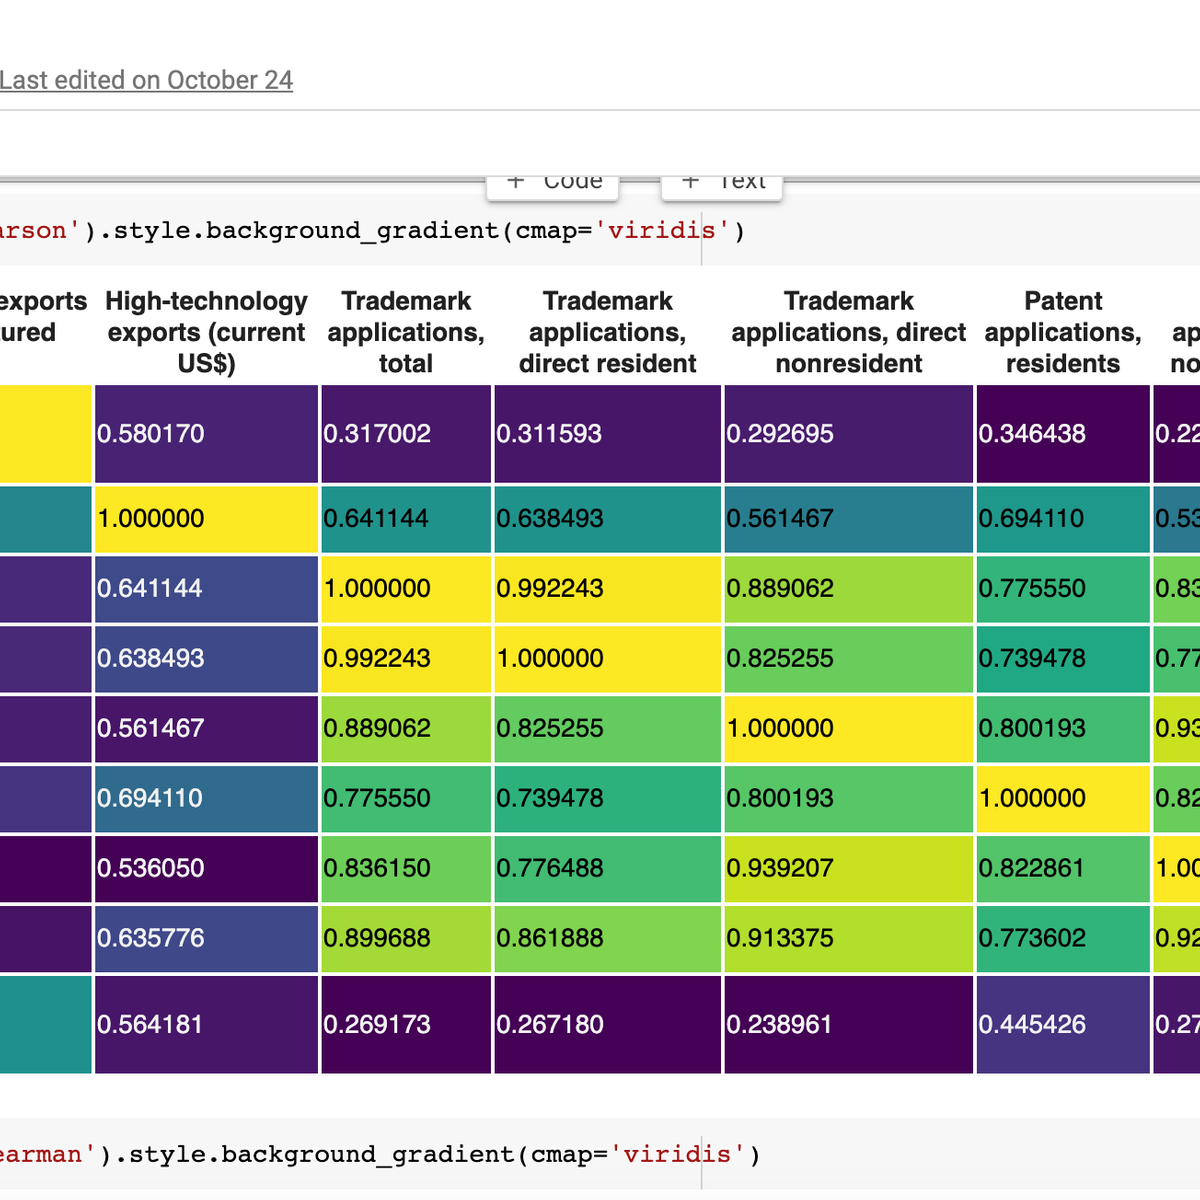
By the end of this project, you will learn how to use Python for basic statistics (including t-tests and correlations). We will learn all the important steps of analysis, including loading, sorting and cleaning data. In this course, we will use exploratory data analysis to understand our data and plot boxplots to visualize the data. Boxplots also allow us to investigate any outliers in our datasets. We will then learn how to examine relationships between the different data using correlations and scatter plots. Finally, we will compare data using t-tests. Throughout this course we will analyse a dataset on Science and Technology from World Bank. The measures in this dataset are numeric, therefore you will learn how to handle and compare numeric data.
This guided project is for anyone with an interest in performing statistical analysis using Python. This could be someone from a social science background with statistics knowledge who wants to advance their analysis, or anyone interested in analysing data.

Introduction to Statistics in Python
In this project, learners will get a refresher of introductory statistics, learn about different python libraries that can be used to run statistical analysis, and create visualizations to represent the results. By the end of the project, the learners will import a real world data set, run statistical analysis to find means, medians , standard deviations, correlations, and other information of the data. The learners will also create distinct graphs and plots to represent the data.
Along the way, the learners will not only learn the frequently used statistics functions, but also learn to navigate documentations for different python libraries in order to find assistance in the implementation of those functions, and find other relevant functions as well. This will help the learners to understand the material and implement more complex functions down the road instead of simply memorizing the syntax of one solution.
Note: This course works best for learners who are based in the North America region. We’re currently working on providing the same experience in other regions.

Getting and Cleaning Data
Before you can work with data you have to get some. This course will cover the basic ways that data can be obtained. The course will cover obtaining data from the web, from APIs, from databases and from colleagues in various formats. It will also cover the basics of data cleaning and how to make data “tidy”. Tidy data dramatically speed downstream data analysis tasks. The course will also cover the components of a complete data set including raw data, processing instructions, codebooks, and processed data. The course will cover the basics needed for collecting, cleaning, and sharing data.

Optimizing Performance of LookML Queries
This is a Google Cloud Self-Paced Lab. In this lab, you'll learn the best methods to optimize query performance in Looker.
Looker is a modern data platform in Google Cloud that you can use to analyze and visualize your data interactively. You can use Looker to do in-depth data analysis, integrate insights across different data sources, build actionable data-driven workflows, and create custom data applications.
Big, complex queries can be costly, and running them repeatedly strains your database, thereby reducing performance. Ideally, you want to avoid re-running massive queries if nothing has changed, and instead, append new data to existing results to reduce repetitive requests. Although there are many ways to optimize performance of LookML queries, this lab focuses on the most commonly used methods to optimize query performance in Looker: persistent derived tables, aggregate awareness, and performantly joining views.

Inferential Statistics
Inferential statistics are concerned with making inferences based on relations found in the sample, to relations in the population. Inferential statistics help us decide, for example, whether the differences between groups that we see in our data are strong enough to provide support for our hypothesis that group differences exist in general, in the entire population.
We will start by considering the basic principles of significance testing: the sampling and test statistic distribution, p-value, significance level, power and type I and type II errors. Then we will consider a large number of statistical tests and techniques that help us make inferences for different types of data and different types of research designs. For each individual statistical test we will consider how it works, for what data and design it is appropriate and how results should be interpreted. You will also learn how to perform these tests using freely available software.
For those who are already familiar with statistical testing: We will look at z-tests for 1 and 2 proportions, McNemar's test for dependent proportions, t-tests for 1 mean (paired differences) and 2 means, the Chi-square test for independence, Fisher’s exact test, simple regression (linear and exponential) and multiple regression (linear and logistic), one way and factorial analysis of variance, and non-parametric tests (Wilcoxon, Kruskal-Wallis, sign test, signed-rank test, runs test).

Introduction to the Tidyverse
This course introduces a powerful set of data science tools known as the Tidyverse. The Tidyverse has revolutionized the way in which data scientists do almost every aspect of their job. We will cover the simple idea of "tidy data" and how this idea serves to organize data for analysis and modeling. We will also cover how non-tidy can be transformed to tidy data, the data science project life cycle, and the ecosystem of Tidyverse R packages that can be used to execute a data science project.
If you are new to data science, the Tidyverse ecosystem of R packages is an excellent way to learn the different aspects of the data science pipeline, from importing the data, tidying the data into a format that is easy to work with, exploring and visualizing the data, and fitting machine learning models. If you are already experienced in data science, the Tidyverse provides a power system for streamlining your workflow in a coherent manner that can easily connect with other data science tools.
In this course it is important that you be familiar with the R programming language. If you are not yet familiar with R, we suggest you first complete R Programming before returning to complete this course.

Data – What It Is, What We Can Do With It
This course introduces students to data and statistics. By the end of the course, students should be able to interpret descriptive statistics, causal analyses and visualizations to draw meaningful insights.
The course first introduces a framework for thinking about the various purposes of statistical analysis. We’ll talk about how analysts use data for descriptive, causal and predictive inference. We’ll then cover how to develop a research study for causal analysis, compute and interpret descriptive statistics and design effective visualizations. The course will help you to become a thoughtful and critical consumer of analytics.
If you are in a field that increasingly relies on data-driven decision making, but you feel unequipped to interpret and evaluate data, this course will help you develop these fundamental tools of data literacy.
Probability and Statistics: To p or not to p?
We live in an uncertain and complex world, yet we continually have to make decisions in the present with uncertain future outcomes. Indeed, we should be on the look-out for "black swans" - low-probability high-impact events.
To study, or not to study? To invest, or not to invest? To marry, or not to marry?
While uncertainty makes decision-making difficult, it does at least make life exciting! If the entire future was known in advance, there would never be an element of surprise. Whether a good future or a bad future, it would be a known future.
In this course we consider many useful tools to deal with uncertainty and help us to make informed (and hence better) decisions - essential skills for a lifetime of good decision-making.
Key topics include quantifying uncertainty with probability, descriptive statistics, point and interval estimation of means and proportions, the basics of hypothesis testing, and a selection of multivariate applications of key terms and concepts seen throughout the course.
Popular Internships and Jobs by Categories
Find Jobs & Internships
Browse
© 2024 BoostGrad | All rights reserved