Back to Courses





Business Essentials Courses - Page 60
Showing results 591-600 of 645

Sales Pitch and Closing
In Course 3 of the Art of Sales Specialization, you will learn how to give great presentations with dashing style and self-confidence. You will also learn how to ask the looming closing question. Finally, you will learn how to develop your brand and go above and beyond for your clients.

Data Visualization and Dashboards with Excel and Cognos
This course covers some of the first steps in the development of data visualizations using spreadsheets and dashboards. Begin the process of telling a story with your data by creating the many types of charts that are available in spreadsheets like Excel. Explore the different tools of a spreadsheet, such as the important pivot function and the ability to create dashboards and learn how each one has its own unique property to transform your data. Continue to gain valuable experience by becoming familiar with the popular analytics tool - IBM Cognos Analytics - to create interactive dashboards.
By completing this course, you will have a basic understanding of using spreadsheets as a data visualization tool. You will gain the ability to effectively create data visualizations, such as charts or graphs, and will begin to see how they play a key role in communicating your data analysis findings. All of this can be accomplished by learning the basics of data analysis with Excel and IBM Cognos Analytics, without having to write any code. By the end of this course you will be able to describe common dashboarding tools used by a data analyst, design and create a dashboard in a cloud platform, and begin to elevate your confidence level in creating intermediate level data visualizations.
Throughout this course you will encounter numerous hands-on labs and a final project. With each lab, gain hands-on experience with creating basic and advanced charts, then continue through the course and begin creating dashboards with spreadsheets and IBM Cognos Analytics. You will then end this course by creating a set of data visualizations with IBM Cognos Analytics and creating an interactive dashboard that can be shared with peers, professional communities or prospective employers.
This course does not require any prior data analysis, or computer science experience. All you need to get started is basic computer literacy, high school level math, access to a modern web browser such as Chrome or Firefox, the ability to create a Microsoft account to access Excel for the Web, and a basic understanding of Excel spreadsheets.

Project Management: Foundations and Initiation
Project Management: Foundations and Initiation provides students the foundational knowledge of how engineering projects are managed and initiated. Project managers are responsible for project scope, stakeholder management, effective communication, and team leadership. In this course, you will develop introductory skills needed to manage traditional engineering projects, along with tools needed to engage stakeholders and build diverse teams.
This course can be taken for academic credit as part of CU Boulder’s Master of Engineering in Engineering Management (ME-EM) degree offered on the Coursera platform. The ME-EM is designed to help engineers, scientists, and technical professionals move into leadership and management roles in the engineering and technical sectors. With performance-based admissions and no application process, the ME-EM is ideal for individuals with a broad range of undergraduate education and/or professional experience. Learn more about the ME-EM program at https://www.coursera.org/degrees/me-engineering-management-boulder.
Logo image courtesy of Jehyun Sung, available on Unsplash at https://unsplash.com/photos/6U5AEmQIajg?utm_source=email&utm_medium=referral&utm_content=photos-page-share

Excel for Beginners: Introduction to Spreadsheets
This 1-hour, project-based course is an introduction to spreadsheets. We’ll be using Excel on the Web in this project, which is the free spreadsheet program offered by Microsoft. However, all of the concepts that you will learn in this project will be applicable to other spreadsheet programs, such as LibreOffice Calc and Google Sheets.
We will cover the following concepts in a hands-on manner:
- Basic data entry, formatting and calculations
- Relative and absolute cell references
- Formulae and basic functions: sum, average, min, max
- Conditional formatting
Please Note: If you don't have a free Microsoft account, you will need to create one to be able to complete the content.

Fundamentals of Quantitative Modeling
How can you put data to work for you? Specifically, how can numbers in a spreadsheet tell us about present and past business activities, and how can we use them to forecast the future? The answer is in building quantitative models, and this course is designed to help you understand the fundamentals of this critical, foundational, business skill. Through a series of short lectures, demonstrations, and assignments, you’ll learn the key ideas and process of quantitative modeling so that you can begin to create your own models for your own business or enterprise. By the end of this course, you will have seen a variety of practical commonly used quantitative models as well as the building blocks that will allow you to start structuring your own models. These building blocks will be put to use in the other courses in this Specialization.

Foundations of strategic business analytics
Who is this course for?
This course is designed for students, business analysts, and data scientists who want to apply statistical knowledge and techniques to business contexts. For example, it may be suited to experienced statisticians, analysts, engineers who want to move more into a business role.
You will find this course exciting and rewarding if you already have a background in statistics, can use R or another programming language and are familiar with databases and data analysis techniques such as regression, classification, and clustering.
However, it contains a number of recitals and R Studio tutorials which will consolidate your competences, enable you to play more freely with data and explore new features and statistical functions in R.
With this course, you’ll have a first overview on Strategic Business Analytics topics. We’ll discuss a wide variety of applications of Business Analytics. From Marketing to Supply Chain or Credit Scoring and HR Analytics, etc. We’ll cover many different data analytics techniques, each time explaining how to be relevant for your business.
We’ll pay special attention to how you can produce convincing, actionable, and efficient insights. We'll also present you with different data analytics tools to be applied to different types of issues.
By doing so, we’ll help you develop four sets of skills needed to leverage value from data: Analytics, IT, Business and Communication.
By the end of this MOOC, you should be able to approach a business issue using Analytics by (1) qualifying the issue at hand in quantitative terms, (2) conducting relevant data analyses, and (3) presenting your conclusions and recommendations in a business-oriented, actionable and efficient way.
Prerequisites : 1/ Be able to use R or to program 2/ To know the fundamentals of databases, data analysis (regression, classification, clustering)
We give credit to Pauline Glikman, Albane Gaubert, Elias Abou Khalil-Lanvin (Students at ESSEC BUSINESS SCHOOL) for their contribution to this course design.

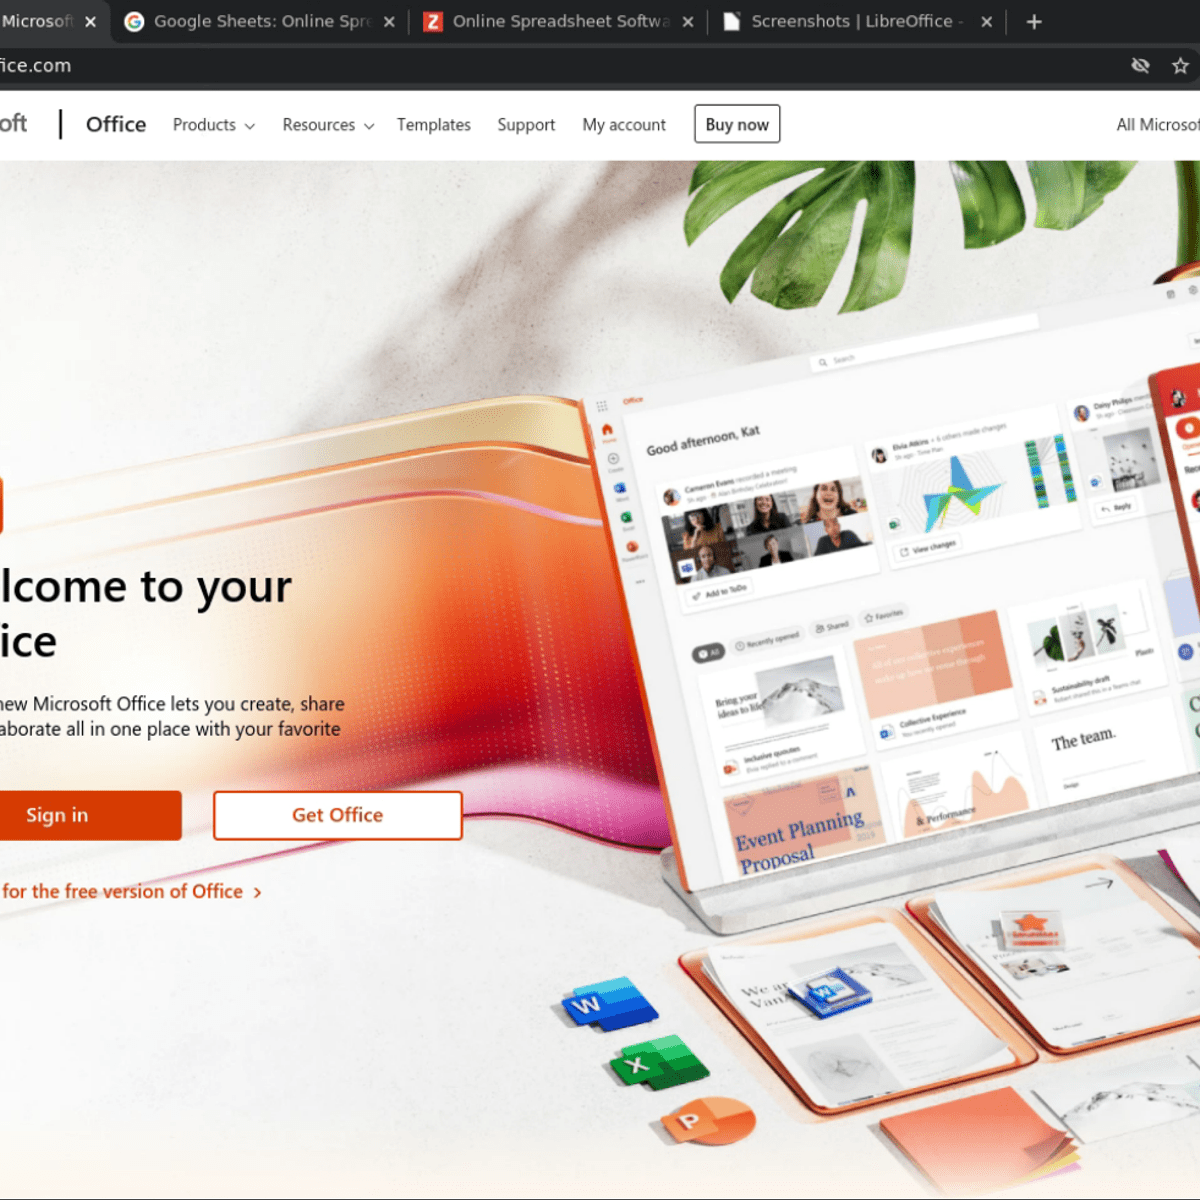
Getting started with Microsoft Office 365
By the end of this project, you will create a free account on Microsoft 365 and you will get access to the entire Microsoft Office 365 and all its online applications. Your new skills will help you manage your tasks, share content from Office 365 with friends, teammates, coworkers, and even outside organizations.

Plots Creation using Matplotlib Python
By the end of this project, you will be able to add the data in the CSV file to Pandas data frame, plot the graph, and set marker type and color. You will also be able to apply labels, change font size, add grid lines and legends. Finally, you will be able to create the boxplot and save the graph as an image using the matplotlib and seaborn libraries, which are the most important libraries in python that are used for Data Visualization. You can create bar-plots, scatter-plots, histograms, and a lot more with them.
This guided project is for people in the field of data and data analysis. people who want to learn python and Pandas library. It provides you with the important steps to be a data analyst. Moreover, it equips you with the knowledge of python's native data structures

Building Digital Media using Graphic Design in PowerPoint
Digital media assets are becoming needed in everyday life in business and personal aspects. Creating digital media in Microsoft PowerPoint 365 is an easy and free way to build many of the digital assets needed in your life or business.
Learners will follow along with this guided project to learn how to prepare a project within Microsoft PowerPoint. Then, learners will discover how to create digital images and add animations to them. Next, learn how to use transitions and creative commons videos within PowerPoint to make digital videos. Finally, learners will discover how to export and share digital media with others.

Operations Systems Excellence
The sole task of organisations is to either deliver customers the services that they require, or design, manufacture, and deliver products that customers are after. How do firms and organisations manage the very tasks that they carry out? How can operations themselves give excellence to organisations to enable them to be competitive?
Operations management is concerned with the design, planning and control of operating systems for the provision of goods and services. This course will provide an introduction not only into the development of operational systems but more importantly into the how operating methods can help achieve corporate excellence.
Popular Internships and Jobs by Categories
Find Jobs & Internships
Browse
© 2024 BoostGrad | All rights reserved