Back to Courses






Data Analysis Courses - Page 77
Showing results 761-770 of 998

ETL Processing on Google Cloud Using Dataflow and BigQuery
This is a self-paced lab that takes place in the Google Cloud console.
In this lab you will build several Data Pipelines that will ingest data from a publicly available dataset into BigQuery.

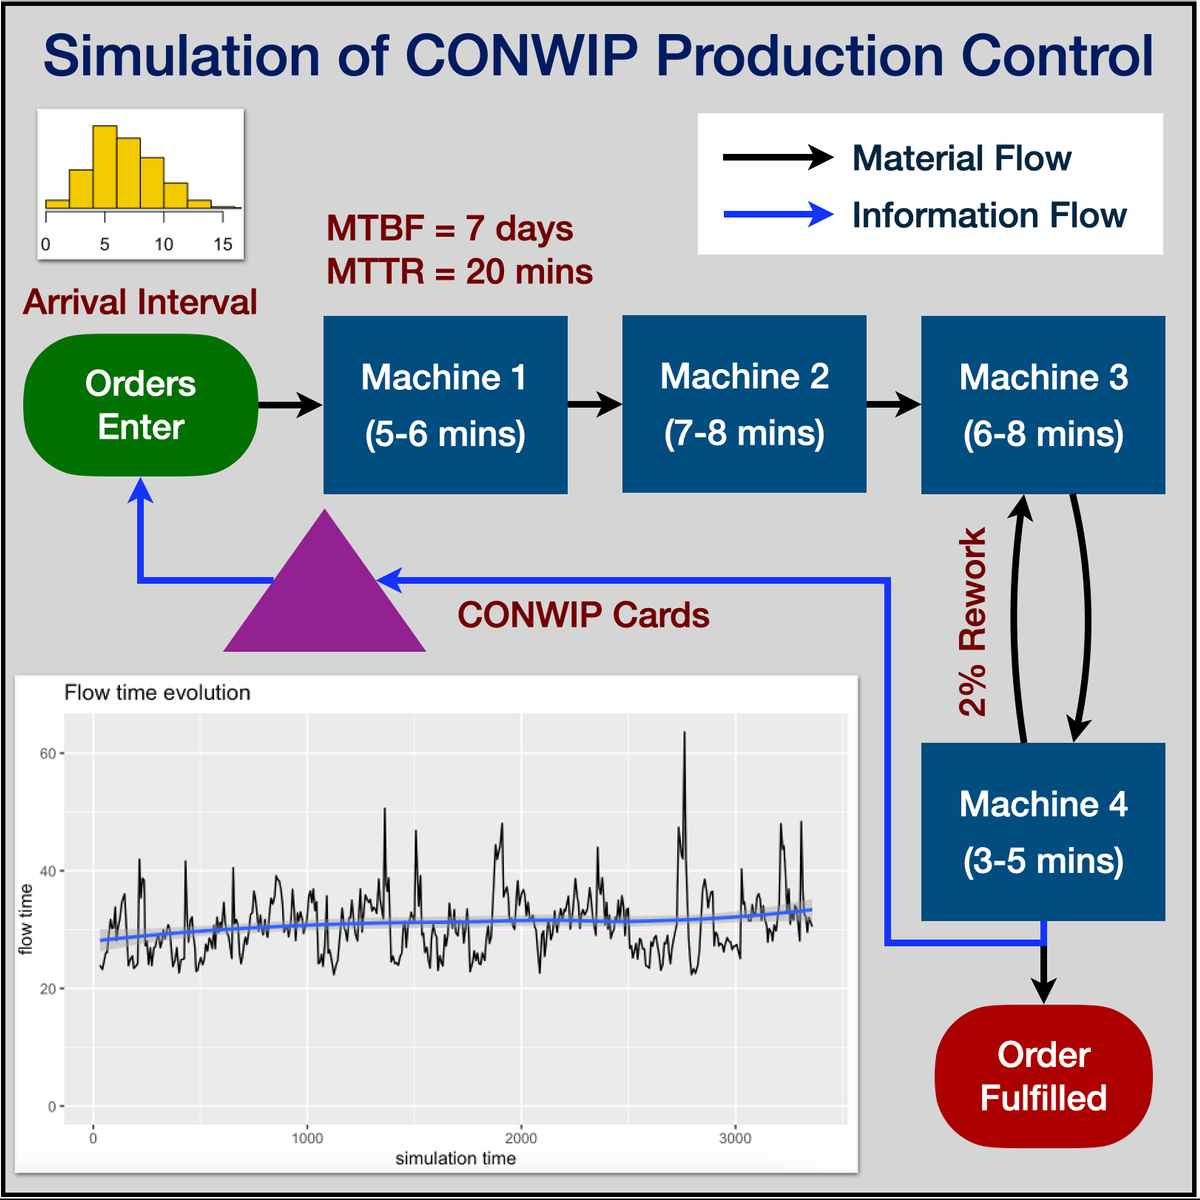
Simulation of CONWIP Production Control Using R Simmer
By the end of this project, you will learn gain introductiory knowledge of Discrete Event Simulation, use R Studio and Simmer library, create statistical variables required for simulation, define process trajectory, define and assign resources, define arrivals (eg. incoming customers / work units), run simulation in R, store results in data frames, plot charts and interpret the results.

Interactive Statistical Data Visualization 101
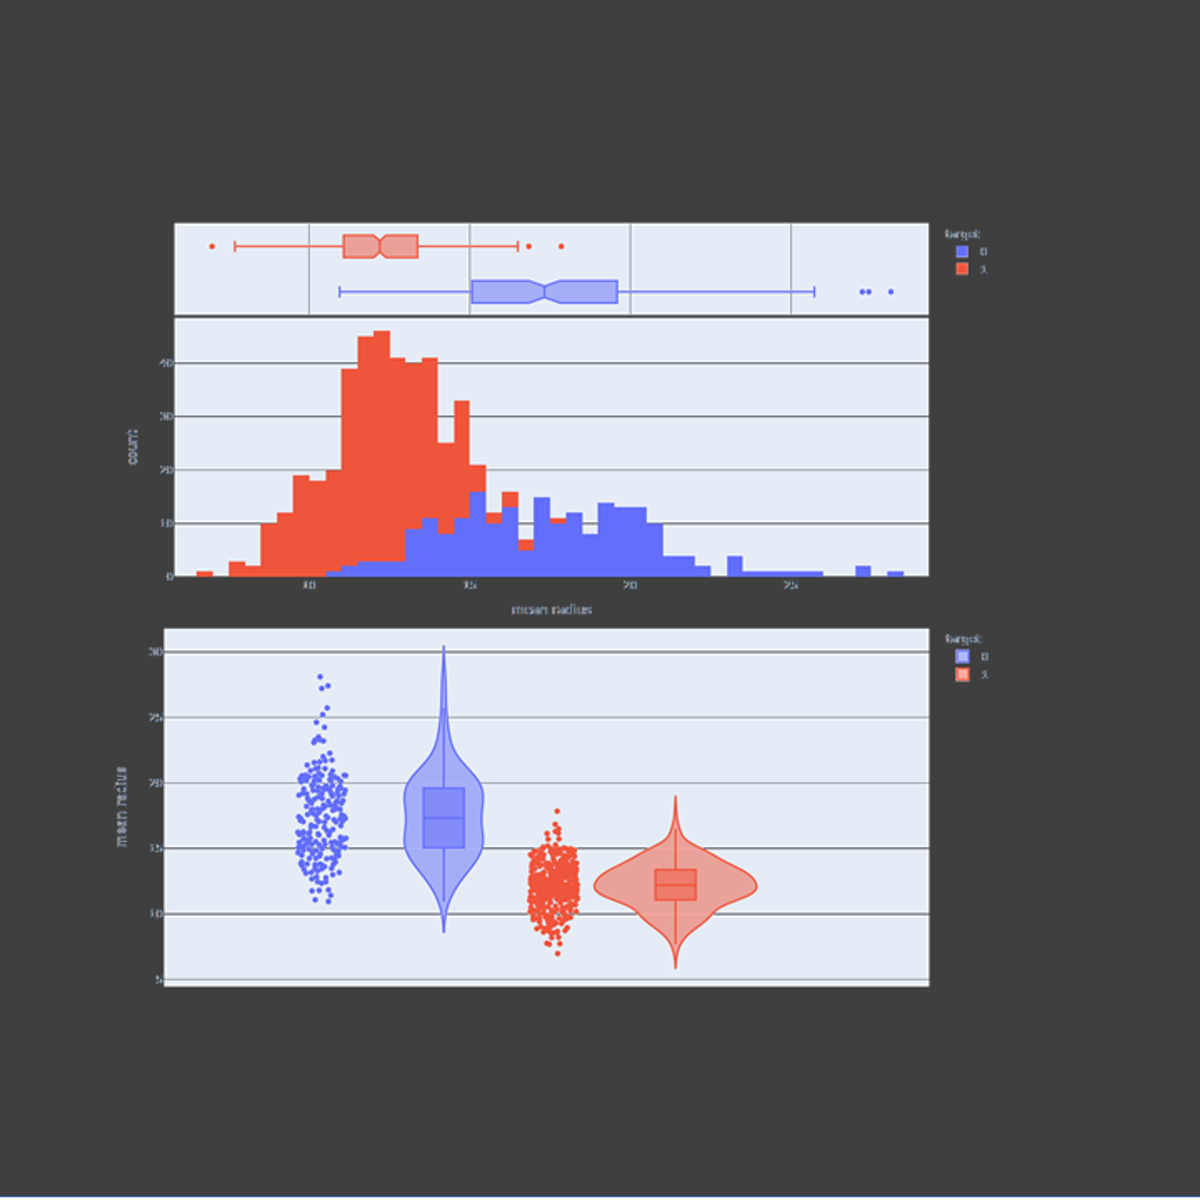
In this guided project, we will explore plotly express to visualize statistical plots such as box plots, histograms, heatmaps, density maps, contour plots, and violin plots. Plotly express is a super powerful Python package that empowers anyone to create, manipulate and render graphical figures. This crash course is super practical and directly applicable to many industries such as banking, finance and tech industries.
Note: This course works best for learners who are based in the North America region. We’re currently working on providing the same experience in other regions.

Predicting Salaries with Simple Linear Regression in R
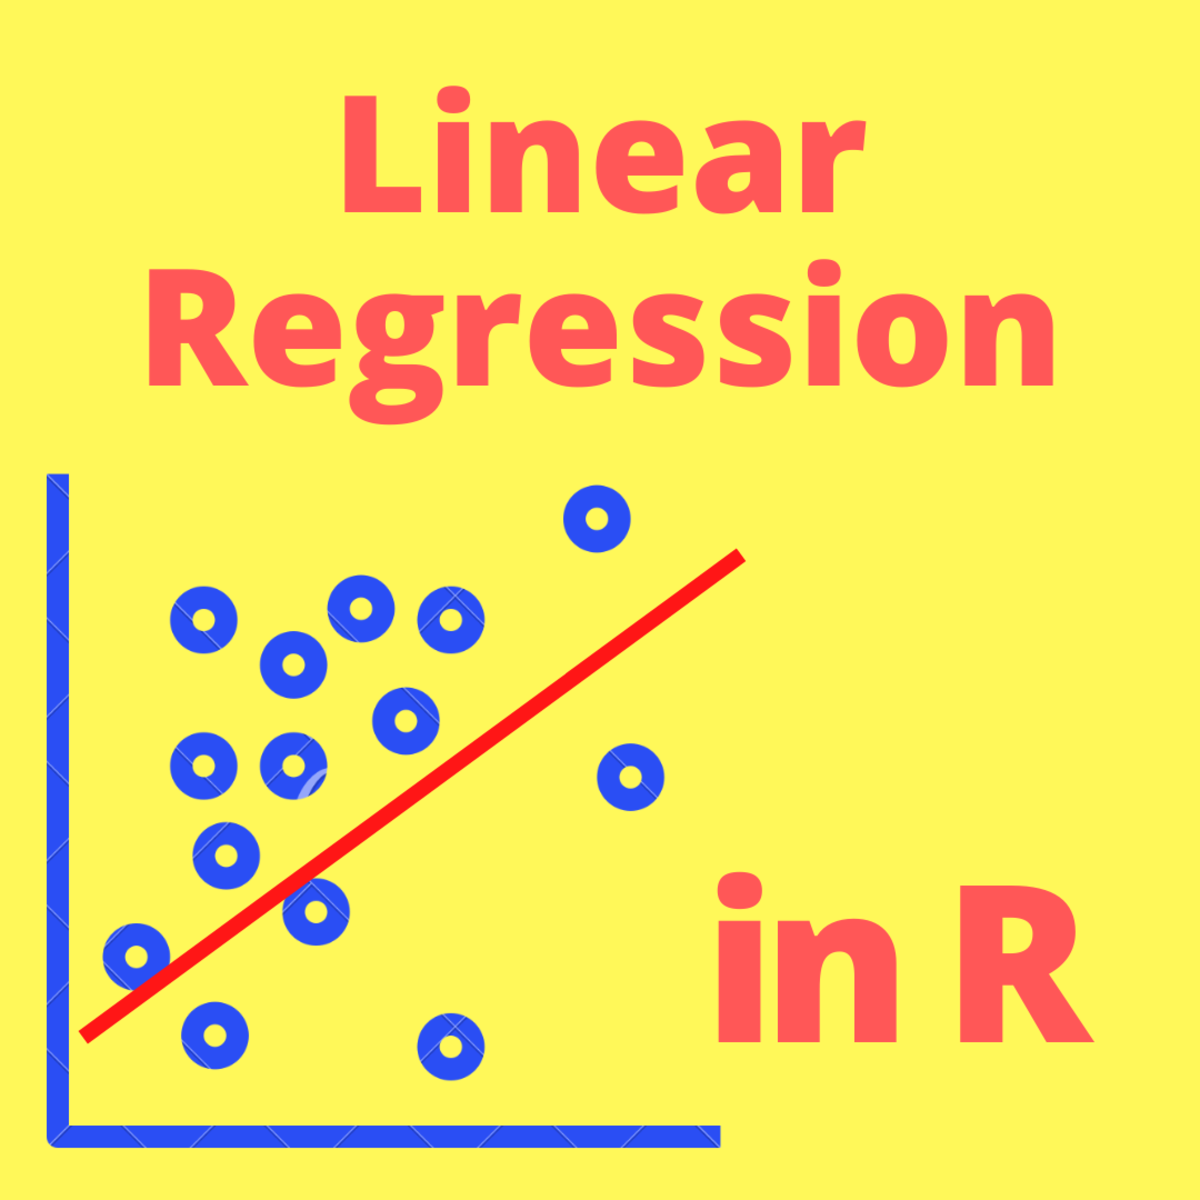
In this 1-hour long project-based course, you will learn how to create a simple linear regression algorithm and use it to solve a basic regression problem. By the end of this project, you will have built, trained, tested, and visualized a Regression model that will be able to accurately predict the salary of a data scientist if provided with some information about years of experience.
In order to be successful in this project, you should just know the basics of R and linear regression.

Social Science Approaches to the Study of Chinese Society Part 1
This course seeks to turn learners into informed consumers of social science research. It introduces concepts, standards, and principles of social science research to the interested non-expert. Learners who complete the course will be able to assess evidence and critically evaluate claims about important social phenomena. It reviews the origins and development of social science, describes the process of discovery in contemporary social science research, and explains how contemporary social science differs from apparently related fields. It describes the goals, basic paradigms, and methodologies of the major social science disciplines. It offers an overview of the major questions that are the focus of much contemporary social science research, overall and for China. Special emphasis is given to explaining the challenges that social scientists face in drawing conclusions about cause and effect from their studies, and offers an overview of the approaches that are used to overcome these challenges. Explanation is non-technical and does not involve mathematics. Statistics and quantitative methods are not covered.
Explore the big questions in social science and learn how you can be a critical, informed consumer of social science research.
Course Overview video: https://youtu.be/QuMOAlwhpvU
After you complete Part 1, enroll in Part 2 to learn how to be a PRODUCER of Social science research.
Part 2: https://www.coursera.org/learn/social-science-research-chinese-society

Web Applications and Command-Line Tools for Data Engineering
In this fourth course of the Python, Bash and SQL Essentials for Data Engineering Specialization, you will build upon the data engineering concepts introduced in the first three courses to apply Python, Bash and SQL techniques in tackling real-world problems. First, we will dive deeper into leveraging Jupyter notebooks to create and deploy models for machine learning tasks. Then, we will explore how to use Python microservices to break up your data warehouse into small, portable solutions that can scale. Finally, you will build a powerful command-line tool to automate testing and quality control for publishing and sharing your tool with a data registry.

Introduction to Data, Signal, and Image Analysis with MATLAB
Welcome to Introduction to Data, Signal, and Image Analysis with MATLAB!
MATLAB is an extremely versatile programming language for data, signal, and image analysis tasks. This course provides an introduction on how to use MATLAB for data, signal, and image analysis. After completing the course, learners will understand how machine learning methods can be used in MATLAB for data classification and prediction; how to perform data visualization, including data visualization for high dimensional datasets; how to perform image processing and analysis methods, including image filtering and image segmentation; and how to perform common signal analysis tasks, including filter design and frequency analysis.

Fundamentals of Data Warehousing
Welcome to Fundamentals of Data Warehousing, the third course of the Key Technologies of Data Analytics specialization. By enrolling in this course, you are taking the next step in your career in data analytics. This course is the third of a series that aims to prepare you for a role working in data analytics. In this course, you will be introduced to many of the core concepts of data warehousing. You will learn about the primary components of data warehousing. We’ll go through the common data warehousing architectures. The hands-on material offers to add storage to your cloud environment and configure a database. This course covers a wide variety of topics that are critical for understanding data warehousing and are designed to give you an introduction and overview as you begin to build relevant knowledge and skills.

Python for Data Visualization:Matplotlib & Seaborn(Enhanced)
In this hands-on project, we will understand the fundamentals of data visualization with Python and leverage the power of two important python libraries known as Matplotlib and seaborn. We will learn how to generate line plots, scatterplots, histograms, distribution plot, 3D plots, pie charts, pair plots, countplots and many more!
Note: This course works best for learners who are based in the North America region. We’re currently working on providing the same experience in other regions.

Creating Dashboards and Storytelling with Tableau
Leveraging the visualizations you created in the previous course, Visual Analytics with Tableau, you will create dashboards that help you identify the story within your data, and you will discover how to use Storypoints to create a powerful story to leave a lasting impression with your audience.
You will balance the goals of your stakeholders with the needs of your end-users, and be able to structure and organize your story for maximum impact. Throughout the course you will apply more advanced functions within Tableau, such as hierarchies, actions and parameters to guide user interactions. For your final project, you will create a compelling narrative to be delivered in a meeting, as a static report, or in an interactive display online.
Popular Internships and Jobs by Categories
Browse
© 2024 BoostGrad | All rights reserved


