Back to Courses
Interactive Statistical Data Visualization 101
Overview
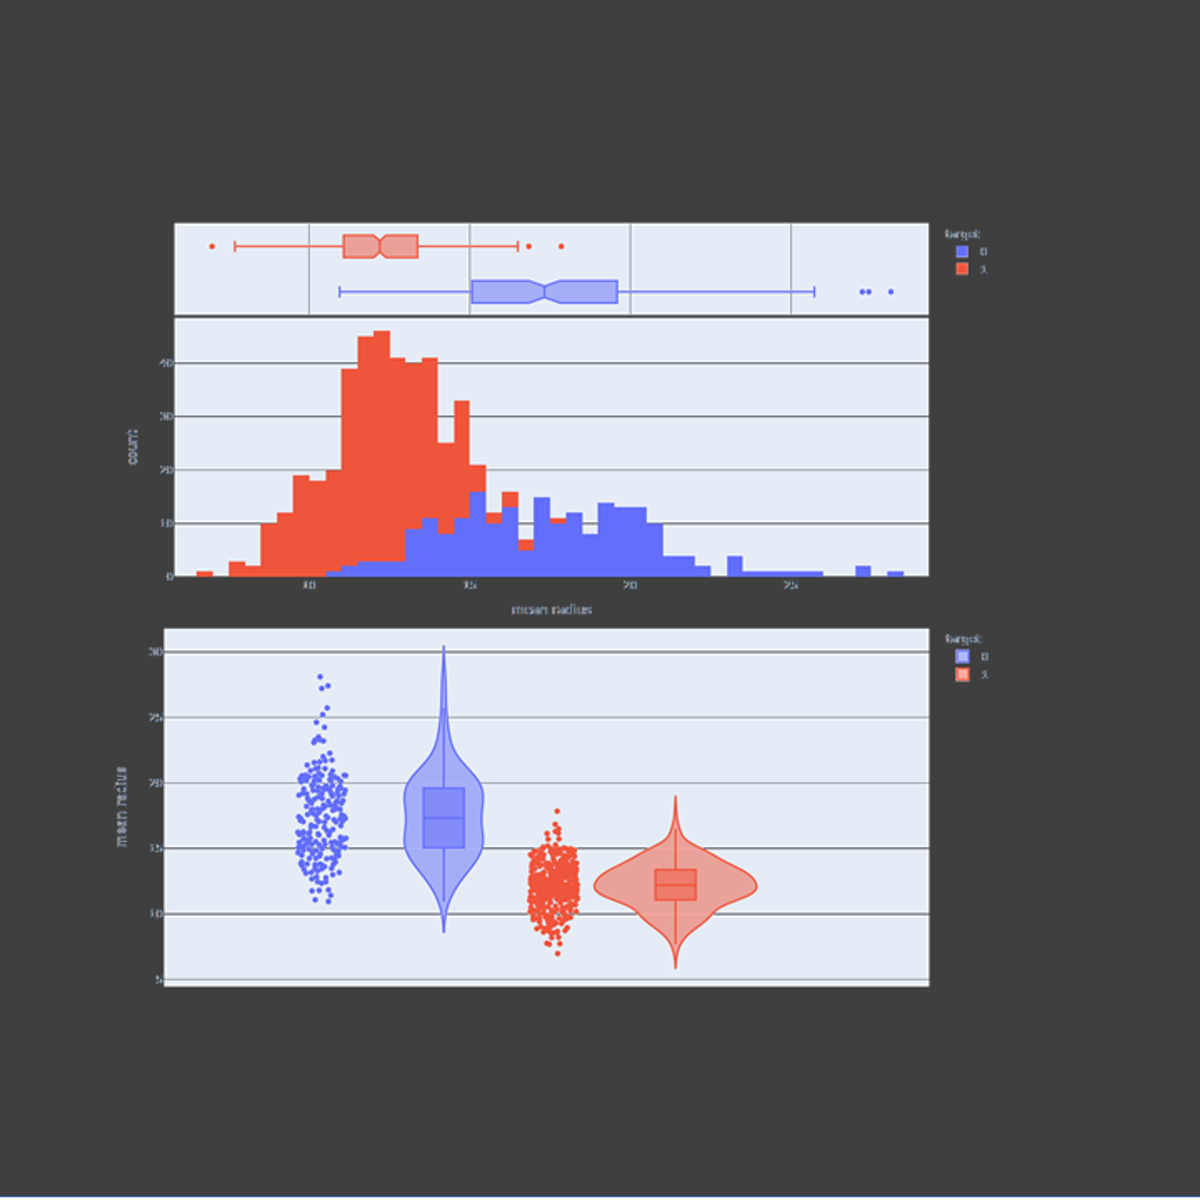
In this guided project, we will explore plotly express to visualize statistical plots such as box plots, histograms, heatmaps, density maps, contour plots, and violin plots. Plotly express is a super powerful Python package that empowers anyone to create, manipulate and render graphical figures. This crash course is super practical and directly applicable to many industries such as banking, finance and tech industries. Note: This course works best for learners who are based in the North America region. We’re currently working on providing the same experience in other regions.
