Back to Courses


Data Analysis Courses - Page 63
Showing results 621-630 of 998

Data Engineering with MS Azure Synapse Apache Spark Pools
In this course, you will learn how to perform data engineering with Azure Synapse Apache Spark Pools, which enable you to boost the performance of big-data analytic applications by in-memory cluster computing.
You will learn how to differentiate between Apache Spark, Azure Databricks, HDInsight, and SQL Pools and understand the use-cases of data-engineering with Apache Spark in Azure Synapse Analytics. You will also learn how to ingest data using Apache Spark Notebooks in Azure Synapse Analytics and transform data using DataFrames in Apache Spark Pools in Azure Synapse Analytics. You will integrate SQL and Apache Spark pools in Azure Synapse Analytics. You will also learn how to monitor and manage data engineering workloads with Apache Spark in Azure Synapse Analytics.
This course is part of a Specialization intended for Data engineers and developers who want to demonstrate their expertise in designing and implementing data solutions that use Microsoft Azure data services for anyone interested in preparing for the Exam DP-203: Data Engineering on Microsoft Azure (beta). You will take a practice exam that covers key skills measured by the certification exam.
This is the sixth course in a program of 10 courses to help prepare you to take the exam so that you can have expertise in designing and implementing data solutions that use Microsoft Azure data services. The Data Engineering on Microsoft Azure exam is an opportunity to prove knowledge expertise in integrating, transforming, and consolidating data from various structured and unstructured data systems into structures that are suitable for building analytics solutions that use Microsoft Azure data services. Each course teaches you the concepts and skills that are measured by the exam.
By the end of this Specialization, you will be ready to take and sign-up for the Exam DP-203: Data Engineering on Microsoft Azure (beta).

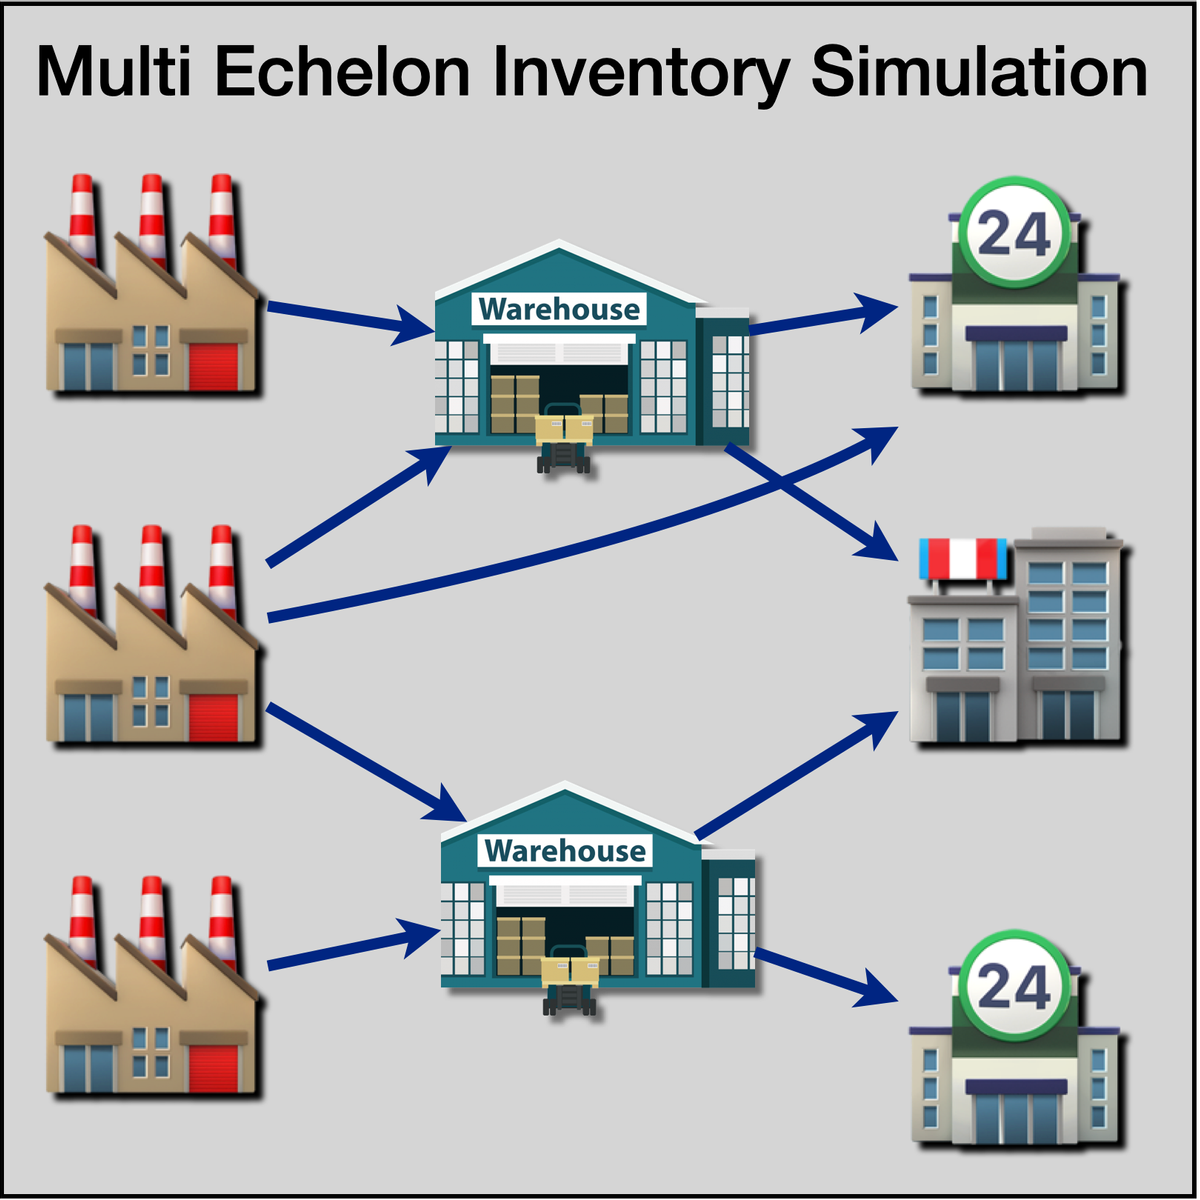
Multi-Echelon Inventory Simulation Using R Simmer
Welcome to "Multi Echelon Inventory Simulation Using R Simmer". This is a project-based course which should take about 2 hours to finish. Before diving into the project, please take a look at the course objectives and structure. By the end of this project, you will gain introductiory knowledge of Discrete Event Simulation, Multi Echelon Inventory Systems, be able to use R Studio and Simmer library, create statistical variables required for simulation, define process trajectory, define and assign resources, define arrivals (eg. incoming customers / work units), run simulation in R, store results in data frames, plot charts and interpret the results.

Cloud DNS: Traffic Steering using Geolocation Policy
This is a self-paced lab that takes place in the Google Cloud console.
In this lab you will configure and test the Geolocation routing policy.

Reproducible Templates for Analysis and Dissemination
This course will assist you with recreating work that a previous coworker completed, revisiting a project you abandoned some time ago, or simply reproducing a document with a consistent format and workflow. Incomplete information about how the work was done, where the files are, and which is the most recent version can give rise to many complications. This course focuses on the proper documentation creation process, allowing you and your colleagues to easily reproduce the components of your workflow. Throughout this course, you'll receive helpful demonstrations of RStudio and the R Markdown language and engage in active learning opportunities to help you build a professional online portfolio.

Datadog: Getting started with the Helm Chart
This is a self-paced lab that takes place in the Google Cloud console. In this lab, you will learn how to use the Datadog Helm Chart.
In this lab you will run the Datadog Agent in a Kubernetes cluster as a DaemonSet in order to start collecting your cluster and applications metrics, traces, and logs. You can deploy a Datadog Agent with a Helm chart or directly with a DaemonSet object YAML definition.
In this lab you will be explaining and using those options in a real cluster, checking in real time the features they enable.

Serverless Data Processing with Dataflow: Develop Pipelines
In this second installment of the Dataflow course series, we are going to be diving deeper on developing pipelines using the Beam SDK. We start with a review of Apache Beam concepts. Next, we discuss processing streaming data using windows, watermarks and triggers. We then cover options for sources and sinks in your pipelines, schemas to express your structured data, and how to do stateful transformations using State and Timer APIs. We move onto reviewing best practices that help maximize your pipeline performance. Towards the end of the course, we introduce SQL and Dataframes to represent your business logic in Beam and how to iteratively develop pipelines using Beam notebooks.

Python and Statistics for Financial Analysis
Course Overview: https://youtu.be/JgFV5qzAYno
Python is now becoming the number 1 programming language for data science. Due to python’s simplicity and high readability, it is gaining its importance in the financial industry. The course combines both python coding and statistical concepts and applies into analyzing financial data, such as stock data.
By the end of the course, you can achieve the following using python:
- Import, pre-process, save and visualize financial data into pandas Dataframe
- Manipulate the existing financial data by generating new variables using multiple columns
- Recall and apply the important statistical concepts (random variable, frequency, distribution, population and sample, confidence interval, linear regression, etc. ) into financial contexts
- Build a trading model using multiple linear regression model
- Evaluate the performance of the trading model using different investment indicators
Jupyter Notebook environment is configured in the course platform for practicing python coding without installing any client applications.

Calculating Descriptive Statistics in R
Welcome to this 2-hour long project-based course Calculating Descriptive Statistics in R. In this project, you will learn how to perform extensive descriptive statistics on both quantitative and qualitative variables in R. You will also learn how to calculate the frequency and percentage of categorical variables and check the distribution of quantitative variables. By extension, you will learn how to perform univariate and bivariate statistics for univariate and bivariate variables in R.
Note: You do not need to be a Data Scientist to be successful in this guided project, just a familiarity with basic statistics and using R suffice for this project. If you are not familiar with R and want to learn the basics, start with my previous guided project titled “Getting Started with R”.

Prepare, Clean, Transform, and Load Data using Power BI
Usually, tidy data is a mirage in a real-world setting. Additionally, before quality analysis can be done, data need to be in a proper format. This project-based course, "Prepare, Clean, Transform, and Load Data using Power BI" is for beginner and intermediate Power BI users willing to advance their knowledge and skills.
In this course, you will learn practical ways for data cleaning and transformation using Power BI. We will talk about different data cleaning and transformation tasks like splitting, renaming, adding, removing columns. By the end of this 2-hour-long project, you will change data types, merge and append data sets. By extension, you will learn how to import data from the web and unpivot data.
This project-based course is a beginner to an intermediate-level course in Power BI. Therefore, to get the most of this project, it is essential to have a basic understanding of using a computer before you take this project.

Applied Social Network Analysis in Python
This course will introduce the learner to network analysis through tutorials using the NetworkX library. The course begins with an understanding of what network analysis is and motivations for why we might model phenomena as networks. The second week introduces the concept of connectivity and network robustness. The third week will explore ways of measuring the importance or centrality of a node in a network. The final week will explore the evolution of networks over time and cover models of network generation and the link prediction problem.
This course should be taken after: Introduction to Data Science in Python, Applied Plotting, Charting & Data Representation in Python, and Applied Machine Learning in Python.
Popular Internships and Jobs by Categories
Find Jobs & Internships
Browse
© 2024 BoostGrad | All rights reserved