Back to Courses


Data Analysis Courses - Page 45
Showing results 441-450 of 998
Introduction to Microsoft Azure Synapse Analytics
In this course, you will learn how Azure Synapse Analytics enables you to perform different types of analytics through its’ components that can be used to build Modern Data Warehouses through to advanced analytical solutions. You will learn how Azure Synapse Analytics solves the issue of having a single service to fulfill the broad range of analytics requirements that organizations face today and take a tour of the core application used to interact with the various components of Azure Synapse Analytics. You will learn the various components of Azure Synapse Analytics that enable you to build your analytical solutions in one place.
This course is part of a Specialization intended for Data engineers and developers who want to demonstrate their expertise in designing and implementing data solutions that use Microsoft Azure data services for anyone interested in preparing for the Exam DP-203: Data Engineering on Microsoft Azure (beta).
This is the fourth course in a program of 10 courses to help prepare you to take the exam so that you can have expertise in designing and implementing data solutions that use Microsoft Azure data services. The Data Engineering on Microsoft Azure exam is an opportunity to prove knowledge expertise in integrating, transforming, and consolidating data from various structured and unstructured data systems into structures that are suitable for building analytics solutions that use Microsoft Azure data services. Each course teaches you the concepts and skills that are measured by the exam.
By the end of this Specialization, you will be ready to take and sign-up for the Exam DP-203: Data Engineering on Microsoft Azure (beta).
Linux and Bash for Data Engineering
In this second course of the Python, Bash and SQL Essentials for Data Engineering Specialization, you will learn the fundamentals of Linux necessary to perform data engineering tasks. Additionally, you will explore how to use both Bash and zsh configurations, and develop the syntax needed to interact and control Linux. These skills will allow you to manage and manipulate databases in a Bash environment.
PyCaret: Anatomy of Regression
In this 2 hour and 15 mins long project-based course, you will learn how to ow to set up PyCaret Environment and become familiar with the variety of data preparing tasks done during setup, be able to create, see and compare the performance of several models, learn how to tune your model without doing an exhaustive search, create impressive visuals of models, interpret models with the wrapper around SHAP Library and much more & all this with just a few lines of code.
Note: This project works best for learners who are based in the North America region. We’re currently working on providing the same experience in other regions.
Data Visualization using Plotly
Welcome to this 1 hour long guided project on Data Visualization using Plotly. Plotly is a python graphing library which is used to make interactive, publication-quality graphs. It allows users to import, copy and paste, or stream data to be analyzed and visualized.
In this project you will learn how to create beautiful visualizations using Plotly constructs. This guided project is for anyone who wants to learn data visualization or already in the data science field.
Address Business Issues with Data Science
This course is designed for business professionals that want to learn how to determine if a business issue is appropriate for a data science project and apply the data science process.
The typical student in this course will have experience in a business setting and a high-level understanding of fundamental data science concepts, including, but not limited to: types of data, data science roles, the overall data science lifecycle, and the benefits and challenges of data science.
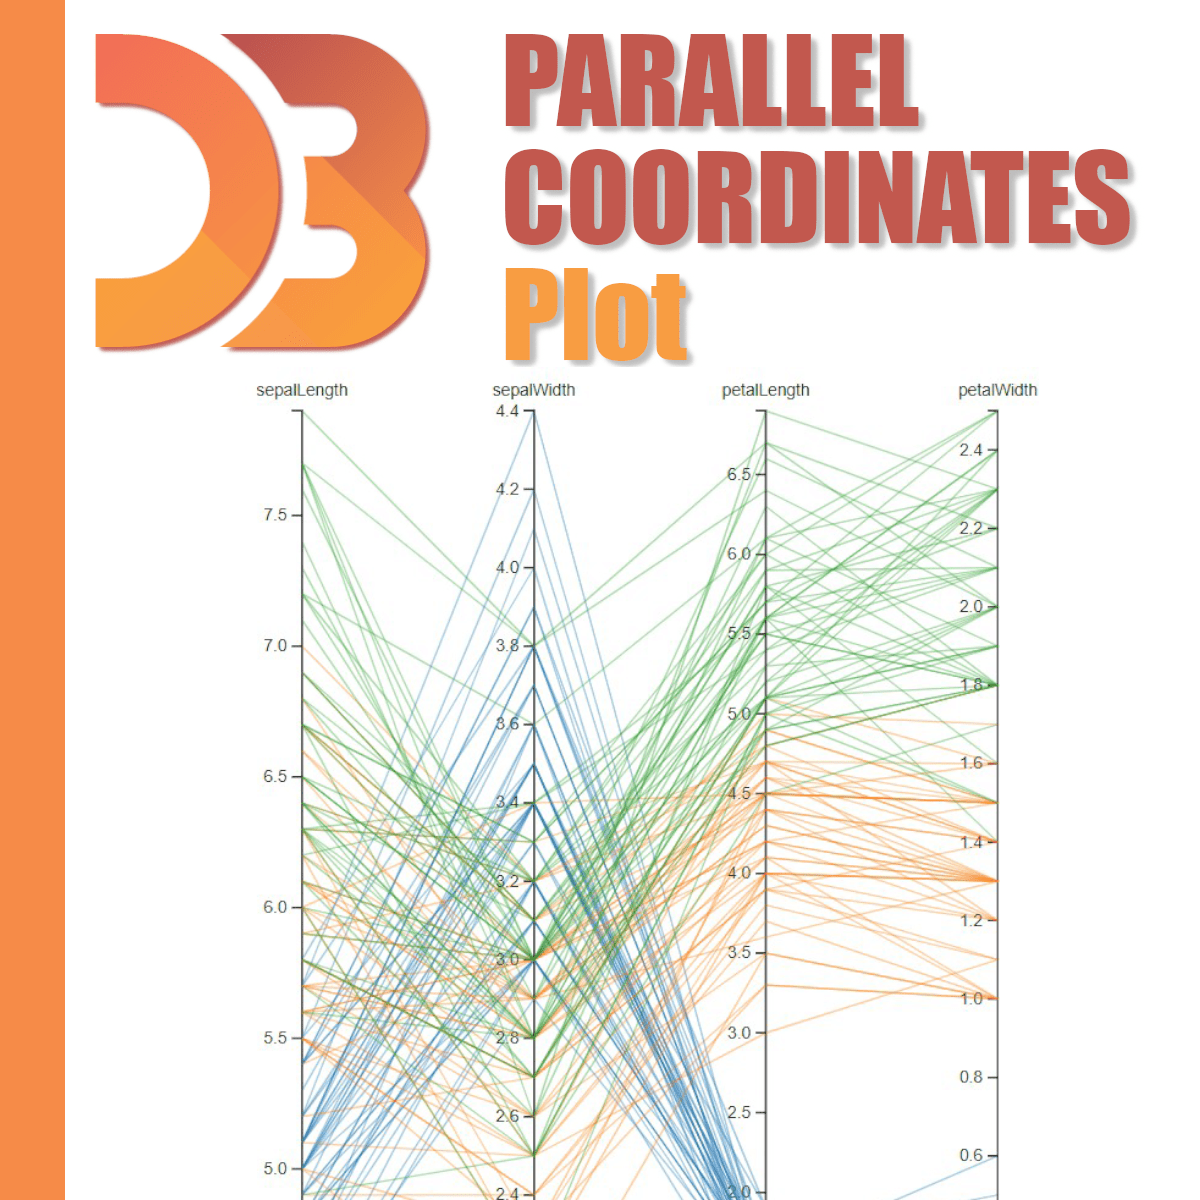
Simple Parallel Coordinates Plot using d3 js
Throughout this guided project we are going to create a simple Parallel Coordinates Plot (PCP) using d3 js. PCP is one of the most common data visualization techniques used to visualize high-dimensional datasets. In this guided project you will create a simple PCP step by step. We will also cover some important topics in data visualization such as Linear and Ordinal scaling to best visualize our data. Having the knowledge of javascript programming language and the basics of d3 js are the two most important prerequisites to get the most out of this guided project.
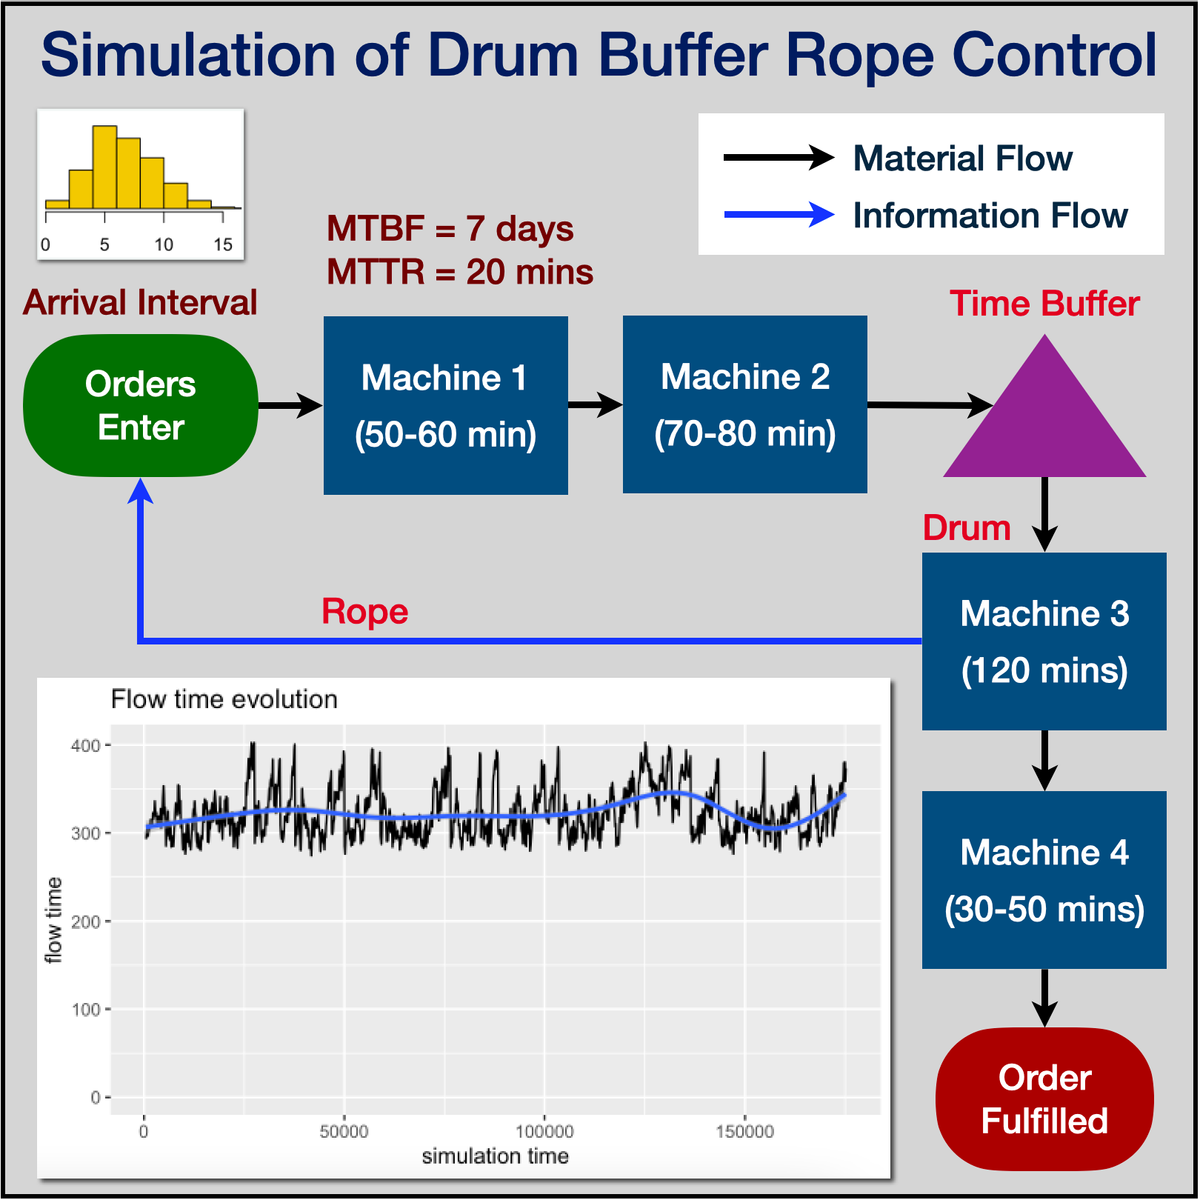
Simulation of Drum-Buffer-Rope Control Using R Simmer
Welcome to "Simulation of Drum-Buffer-Rope Production Control Using R-Simmer". This is a project-based course which should take about 2 hours to finish. Before diving into the project, please take a look at the course objectives and structure. By the end of this project, you will gain introductiory knowledge of Drum-Buffer-Rope Production Control, Discrete Event Simulation, be able to use R Studio and Simmer library, create statistical variables required for simulation, define process trajectory, define and assign resources, define arrivals (eg. incoming customers / work units), run simulation in R, store results in data frames, plot charts and interpret the results.
People Analytics
People analytics is a data-driven approach to managing people at work. For the first time in history, business leaders can make decisions about their people based on deep analysis of data rather than the traditional methods of personal relationships, decision making based on experience, and risk avoidance. In this brand new course, three of Wharton’s top professors, all pioneers in the field of people analytics, will explore the state-of-the-art techniques used to recruit and retain great people, and demonstrate how these techniques are used at cutting-edge companies. They’ll explain how data and sophisticated analysis is brought to bear on people-related issues, such as recruiting, performance evaluation, leadership, hiring and promotion, job design, compensation, and collaboration. This course is an introduction to the theory of people analytics, and is not intended to prepare learners to perform complex talent management data analysis. By the end of this course, you’ll understand how and when hard data is used to make soft-skill decisions about hiring and talent development, so that you can position yourself as a strategic partner in your company’s talent management decisions. This course is intended to introduced you to Organizations flourish when the people who work in them flourish. Analytics can help make both happen. This course in People Analytics is designed to help you flourish in your career, too.
Deep Learning and Reinforcement Learning
This course introduces you to two of the most sought-after disciplines in Machine Learning: Deep Learning and Reinforcement Learning. Deep Learning is a subset of Machine Learning that has applications in both Supervised and Unsupervised Learning, and is frequently used to power most of the AI applications that we use on a daily basis. First you will learn about the theory behind Neural Networks, which are the basis of Deep Learning, as well as several modern architectures of Deep Learning. Once you have developed a few Deep Learning models, the course will focus on Reinforcement Learning, a type of Machine Learning that has caught up more attention recently. Although currently Reinforcement Learning has only a few practical applications, it is a promising area of research in AI that might become relevant in the near future.
After this course, if you have followed the courses of the IBM Specialization in order, you will have considerable practice and a solid understanding in the main types of Machine Learning which are: Supervised Learning, Unsupervised Learning, Deep Learning, and Reinforcement Learning.
By the end of this course you should be able to:
Explain the kinds of problems suitable for Unsupervised Learning approaches
Explain the curse of dimensionality, and how it makes clustering difficult with many features
Describe and use common clustering and dimensionality-reduction algorithms
Try clustering points where appropriate, compare the performance of per-cluster models
Understand metrics relevant for characterizing clusters
Who should take this course?
This course targets aspiring data scientists interested in acquiring hands-on experience with Deep Learning and Reinforcement Learning.
What skills should you have?
To make the most out of this course, you should have familiarity with programming on a Python development environment, as well as fundamental understanding of Data Cleaning, Exploratory Data Analysis, Unsupervised Learning, Supervised Learning, Calculus, Linear Algebra, Probability, and Statistics.
Creating an Interactive Graph with Tableau Public
By the end of this guided project, learners will have created an interactive graph that applies principles of data visualization to tell a story using basic sales data. This project will illustrate some of the basic features of Tableau software and allow learners to obtain a good introduction to using the open source software, Tableau Public. In this project, learners will use sample data as a building block to create a shareable interactive data visualization chart. This skill is helpful for anyone interested in learning more about how to begin working with data to tell a story, highlight change over time, see and understand data, or make well-informed data driven decisions.
Note: This course works best for learners who are based in the North America region. We’re currently working on providing the same experience in other regions.
Popular Internships and Jobs by Categories
Find Jobs & Internships
Browse


© 2024 BoostGrad | All rights reserved