Back to Courses


Data Analysis Courses - Page 46
Showing results 451-460 of 998
Applied Calculus with Python
This course is designed for the Python programmer who wants to develop the foundations of Calculus to help solve challenging problems as well as the student of mathematics looking to learn the theory and numerical techniques of applied calculus implemented in Python. By the end of this course, you will have learned how to apply essential calculus concepts to develop robust Python applications that solve a variety of real-world challenges. Video lectures, readings, worked examples, assessments, and Python code are all provided in the course. These are used to illustrate techniques to solve equations, work with functions, and compute and apply derivatives and integrals. If you are interested in starting to develop concepts in fields such as applied math, data science, cybersecurity, or artificial intelligence, or just need a refresher of calculus or coding in Python, then this course is right for you.
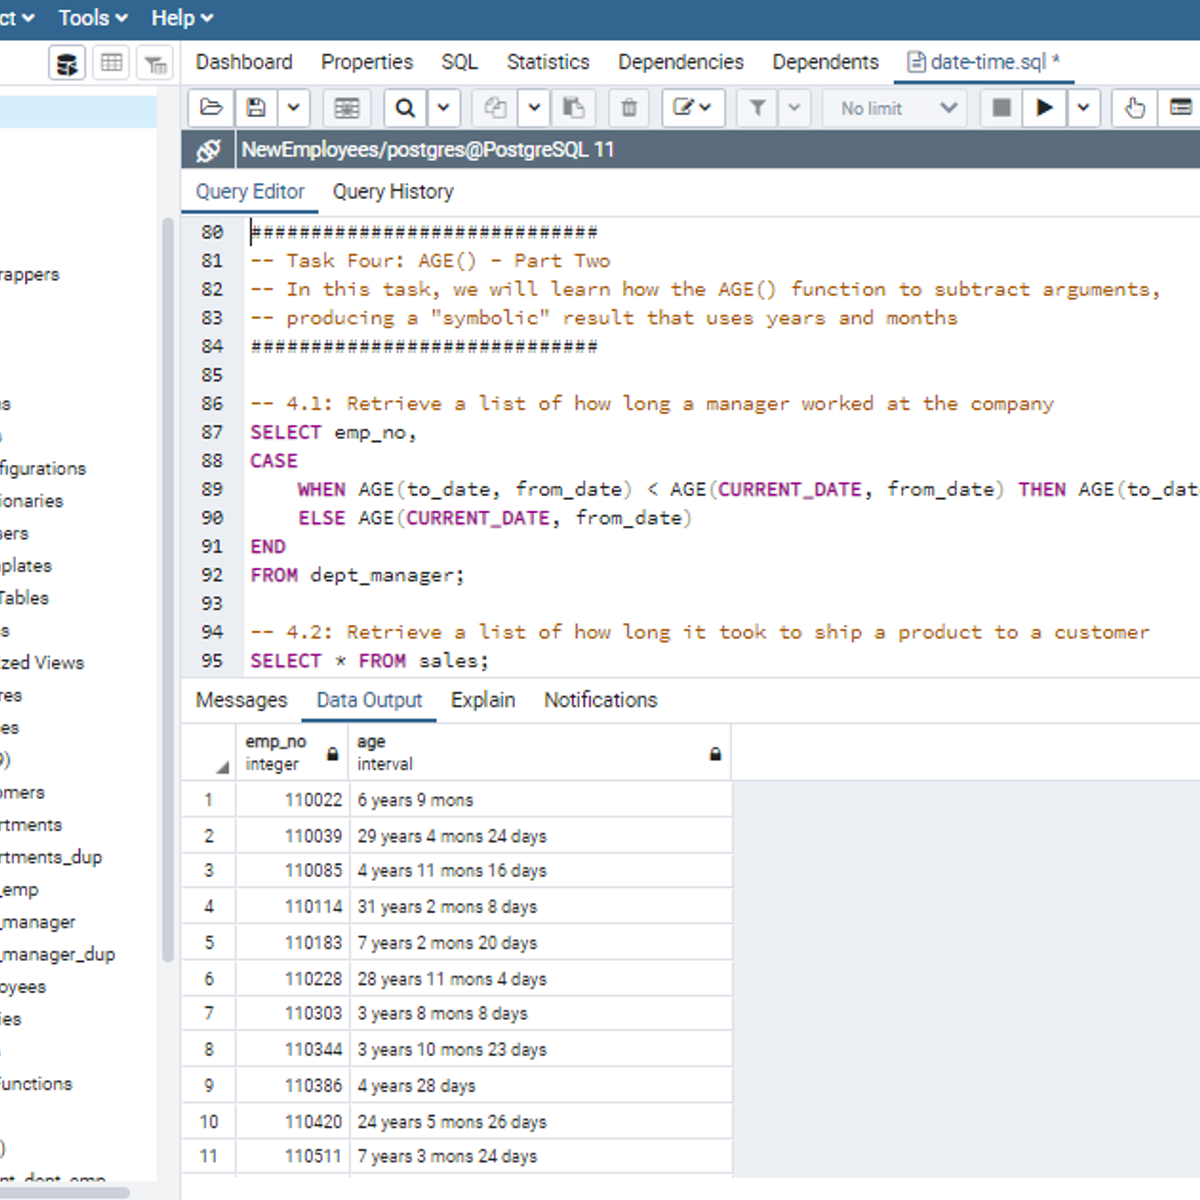
SQL Date Time Functions
Welcome to this project-based course, SQL Date Time Functions. In this project, you will learn how to use SQL Date Time Functions to manipulate tables with data datatypes in a database.
By the end of this 2-and-a-half-hour-long project, you will be able to use different Date Time Functions to retrieve the desired result from a database. In this project, you will learn how to use SQL Date Time Functions like CURRENT_DATE, CURRENT_TIME, CURRENT_TIMESTAMP, AGE, EXTRACT, TO_CHAR, TO_DATE to manipulate date-like data in the employees table. In this project, we will move systematically by first introducing the functions using a simple example. Then, we will write more complex queries using the Date Time Functions in real-life applications. Also, you will learn how to convert a date to a string and vice versa.
Also, for this hands-on project, we will use PostgreSQL as our preferred database management system (DBMS). Therefore, to complete this project, it is required that you have prior experience with using PostgreSQL. Similarly, this project is an advanced SQL concept; so, a good foundation for writing SQL queries is vital to complete this project.
If you are not familiar with writing queries in SQL and SQL joins and want to learn these concepts, start with my previous guided projects titled “Querying Databases using SQL SELECT statement," “Performing Data Aggregation using SQL Aggregate Functions,” and “Mastering SQL Joins.” I taught these guided projects using PostgreSQL. So, taking these projects will give the needed requisite to complete this SQL Date Time Functions project. However, if you are comfortable writing queries in PostgreSQL, please join me on this wonderful ride! Let’s get our hands dirty!
Working with Big Data
By the end of this project, you will set up an environment for Big Data Development using Visual Studio Code, MongoDB and Apache Spark. You will then use the environment to process a large dataset from NOAA showing hourly precipitation rates for a ten year period from the state of Wisconsin.
MongoDB is a widely used NoSQL database well suited for very large datasets or Big Data. It is highly scalable and adaptable as well. Apache Spark is used for efficient in-memory processing of Big Data.
Create Geovisualizations in Tableau
Tableau is widely recognized as one of the premier data visualization software programs. For many years access to the program was limited to those who purchased licenses. Recently, Tableau launched a public version that grants the ability to create amazing data visualizations for free. Account members can also share and join projects to collaborate on projects that can change the world.
In this project, we will learn how to create an account, how to build simple bar graphs, and how to create a geovisualization.
Learning to use this in-demand tool has applications in Marketing, Finance, Operations, Sales, and many other business functions.
Note: This course works best for learners who are based in the North America region. We’re currently working on providing the same experience in other regions.
Data Studio: Qwik Start
This is a self-paced lab that takes place in the Google Cloud console.
Data Studio lets you create dynamic, visually compelling reports and dashboards. Watch the short video <A HREF="https://youtu.be/eSY6daAlk5k">Data Studio: Qwik Start - Qwiklabs Preview</A>.
AI Workflow: Feature Engineering and Bias Detection
This is the third course in the IBM AI Enterprise Workflow Certification specialization. You are STRONGLY encouraged to complete these courses in order as they are not individual independent courses, but part of a workflow where each course builds on the previous ones.
Course 3 introduces you to the next stage of the workflow for our hypothetical media company. In this stage of work you will learn best practices for feature engineering, handling class imbalances and detecting bias in the data. Class imbalances can seriously affect the validity of your machine learning models, and the mitigation of bias in data is essential to reducing the risk associated with biased models. These topics will be followed by sections on best practices for dimension reduction, outlier detection, and unsupervised learning techniques for finding patterns in your data. The case studies will focus on topic modeling and data visualization.
By the end of this course you will be able to:
1. Employ the tools that help address class and class imbalance issues
2. Explain the ethical considerations regarding bias in data
3. Employ ai Fairness 360 open source libraries to detect bias in models
4. Employ dimension reduction techniques for both EDA and transformations stages
5. Describe topic modeling techniques in natural language processing
6. Use topic modeling and visualization to explore text data
7. Employ outlier handling best practices in high dimension data
8. Employ outlier detection algorithms as a quality assurance tool and a modeling tool
9. Employ unsupervised learning techniques using pipelines as part of the AI workflow
10. Employ basic clustering algorithms
Who should take this course?
This course targets existing data science practitioners that have expertise building machine learning models, who want to deepen their skills on building and deploying AI in large enterprises. If you are an aspiring Data Scientist, this course is NOT for you as you need real world expertise to benefit from the content of these courses.
What skills should you have?
It is assumed that you have completed Courses 1 and 2 of the IBM AI Enterprise Workflow specialization and you have a solid understanding of the following topics prior to starting this course: Fundamental understanding of Linear Algebra; Understand sampling, probability theory, and probability distributions; Knowledge of descriptive and inferential statistical concepts; General understanding of machine learning techniques and best practices; Practiced understanding of Python and the packages commonly used in data science: NumPy, Pandas, matplotlib, scikit-learn; Familiarity with IBM Watson Studio; Familiarity with the design thinking process.
Join Tables in an SQL Query in LibreOffice Base
By the end of this project, you will have used LibreOffice Base to write SQL queries that join related tables together to retrieve and display data from multiple tables. Since a well-designed database stores each data topic—such as “student” and “course”—in a separate table, an SQL query is often required to join tables together to get all of the data required. You will learn to do that with the WHERE clause and with the JOIN command in SQL.
Note: This course works best for learners who are based in the North America region. We’re currently working on providing the same experience in other regions.
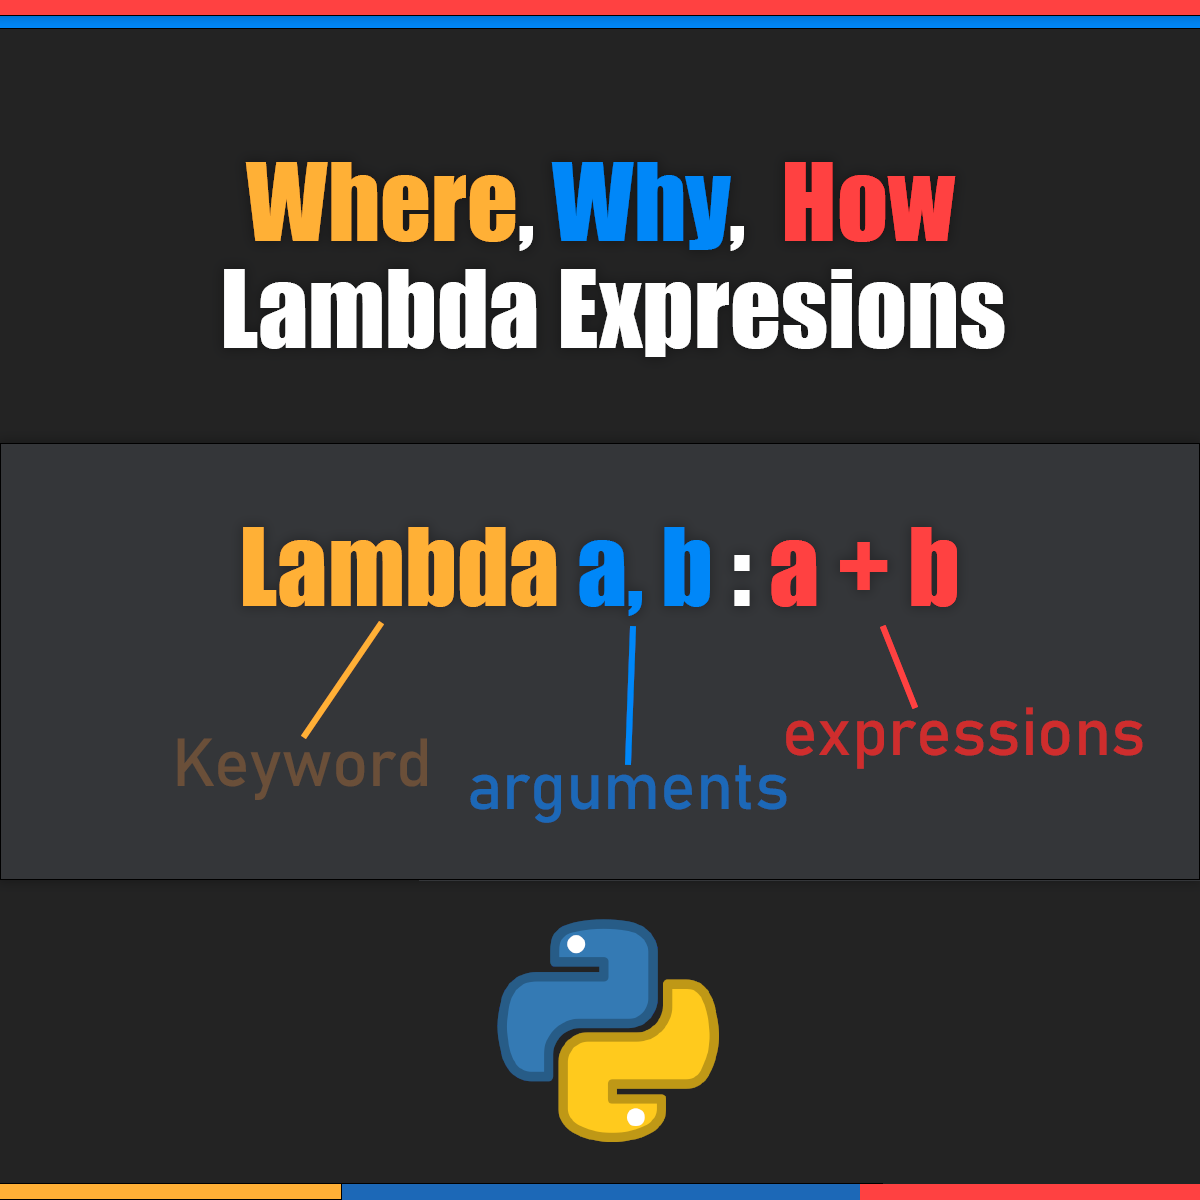
Where, Why, and How of Lambda Functions in Python
In this project we are going to learn about lambda expressions and it's application in python. We are going to start with what is Lambda expression and how we can define it, comparing lambda functions with regular functions in python and at the end we will learn how to use lambda functions for data manipulation and exploration in pandas. this guided-project is completely beginner friendly. you only need to have basic knowledge of python programming and some experience coding in Jupyter notebook environment.
Fundamentals of Data Analysis
This course is the first of a series that aims to prepare you for a role working in data analytics. In this course, you’ll be introduced to many of the primary types of data analytics and core concepts. You’ll learn about the tools and skills required to conduct data analysis. We’ll go through some of the foundational math and statistics used in data analysis and workflows for conducting efficient and effective data analytics. This course covers a wide variety of topics that are critical for working in data analytics and are designed to give you an introduction and overview as you begin to build relevant knowledge and skills.
Grab Data Fast with Vertical and Horizontal LOOKUP
Data can come our way in multiple forms and from multiple file types. It’s likely that at some point you will be faced with a data set that includes categories and subcategories under one heading or under headings with nested subheadings. Cutting through the file structure can seem like a time-consuming task, so it is critical to leverage VLOOKUP and HLOOKUP to pull out the needed data quickly. In this course you will understand how lookup tables work and apply VLOOKUP and HLOOKUP formulas to quickly extract data by treating a section of your spreadsheet as a lookup table. You will do this as we work side-by-side in the free-to-use software Google Sheets.
By the end of this course, you will understand use cases for using vertical and horizontal lookup to extract data when data sets have categories configured with multiple levels. You will also be able to confidently apply VLOOKUP and HLOOKUP formulas to grab data in any spreadsheet software.
Note: This course works best for learners who are based in the North America region. We’re currently working on providing the same experience in other regions.
Popular Internships and Jobs by Categories
Find Jobs & Internships
Browse


© 2024 BoostGrad | All rights reserved